ALPHABETIC REFERENCE EXCEL CARE CONTROL ICONS
74-5577–33 (US) 208
EN2B-0184 GE51 R0518 (Europe)
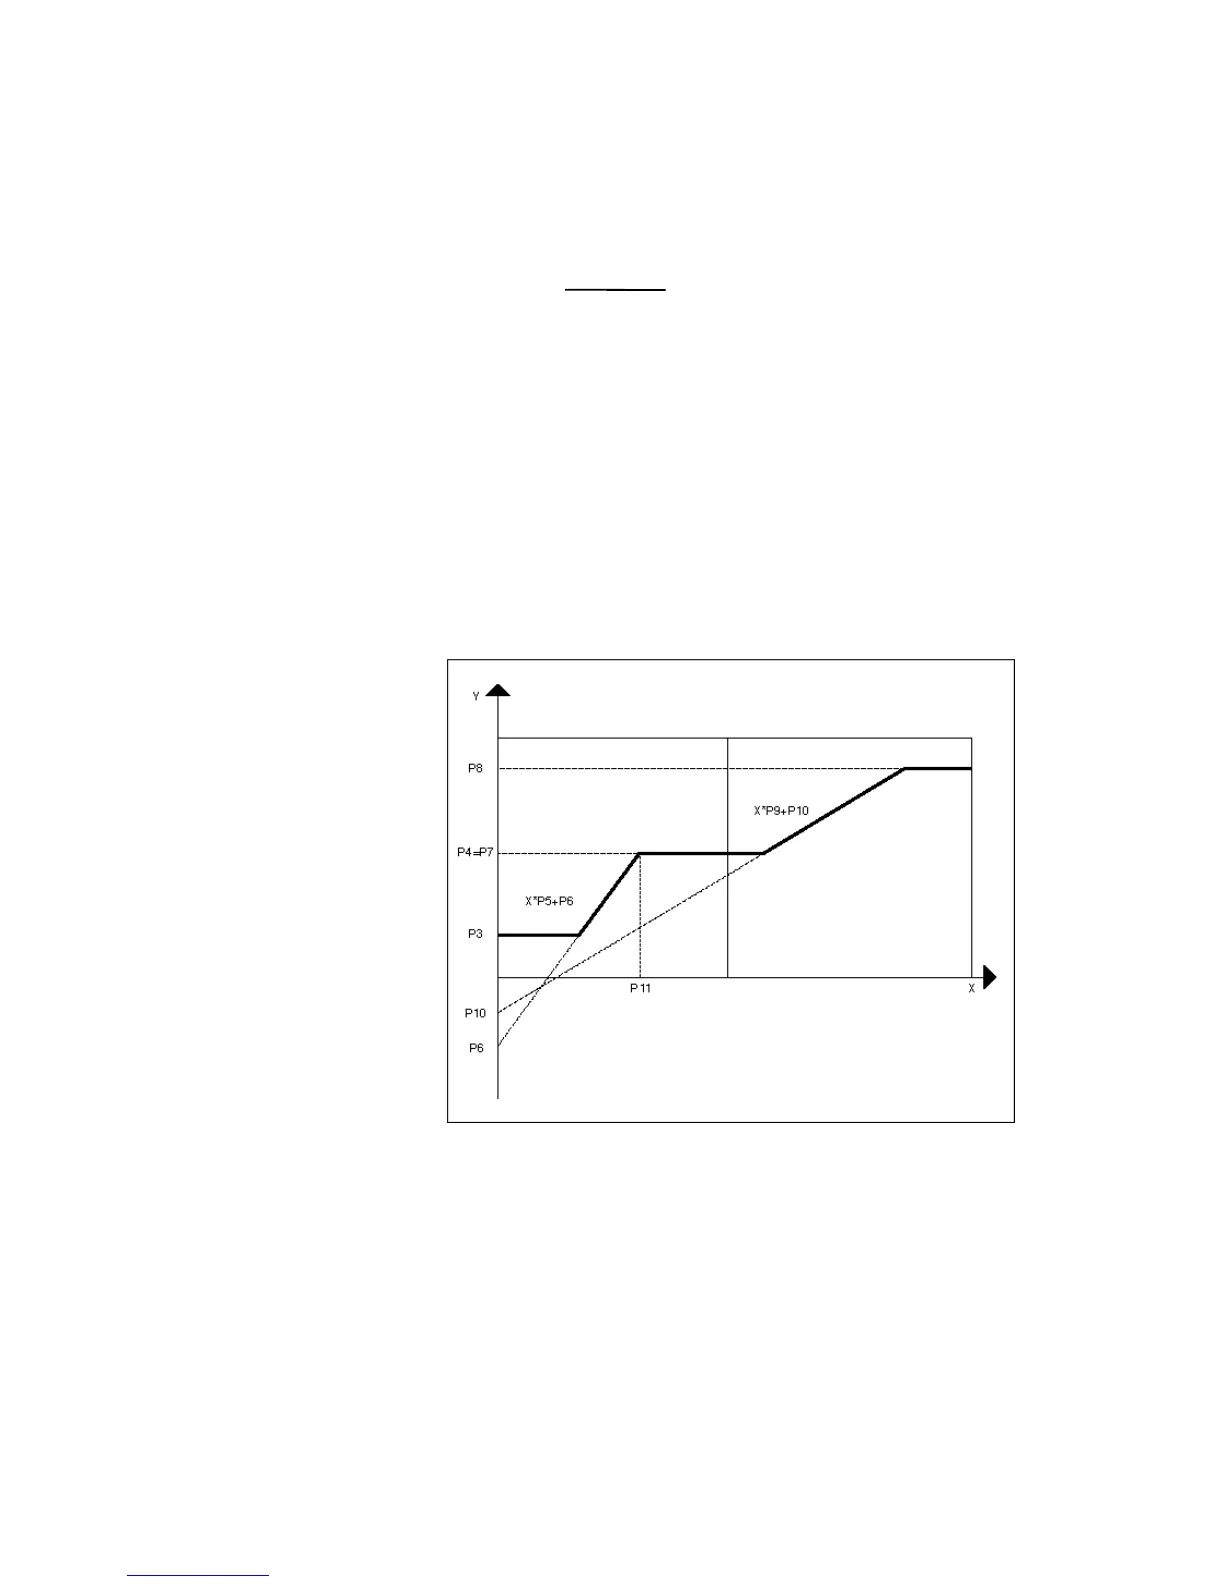
Parameter Number Descriptions P3 Ya(1), minimum value of the first ramp (curve)
P4 Yb(1). maximum value of the first ramp (equivalent to the minimum value of the
second ramp).
P5 Slope of the first ramp. Formula:
P6 Intersection of the Y axis with the first ramp.
P7 Ya(2), minimum value of the second ramp (equivalent to the maximum value of
the first ramp, Yb(1) = P4).
P8 Yb(2), the maximum of the second ramp.
P9 Slope of the second ramp. Formula:
P10 Intersection of the second ramp with the Y axis:
P11 Xb(1), maximum X value of the first ramp.
The following diagram shows the parameters for the RAMP control icon:
Scale Changes When you change the minimum and maximum X and Y scale values, RAMP adjusts
minimum and maximum values for the curves so that they are not outside the overall
X and Y ranges.
For example, assume an application has the following values:
Y scale ranges from 0 through 100 (Ymin through Ymax)
X scale ranges from 0 through 50 (Xmin through Xmax/2)
Curve 1 X scale ranges from 20 through 40 (Xa(1) through Xb(1))
Y scale ranges from 25 through 80 (Ya(1) through Yb(1))
Curve 2 X scale ranges from 65 through 85 (Xa(2) through Xb(2))

 Loading...