EXCEL CARE CONTROL ICONS ALPHABETIC REFERENCE
99 74-5577–33 (US)
EN2B-0184 GE51 R0518 (Europe)
The following table lists the Sliding Window algorithm parameters.
Parameter
Number
Type
Brief Description
Setting
Range
Default
Value
Unit
1 Display Current Power Consumption none none kW
4 Display Possible Power with constant
Power Consumption
none none kW
6 Comm. Safety Margin 0-1000 0 kW
9 Comm. Measurement Algorithm
1=Sliding Window
1, 2, or 3 3 Integer
10 Comm. Measurement Interval/Window Size 1-7200 15 min
13 Comm. Power Limit 1
0-10
6
10000 kW
14 Comm. Power Limit 2
0-10
6
10000 kW
Refer to the General Functions subsection for more parameter details.
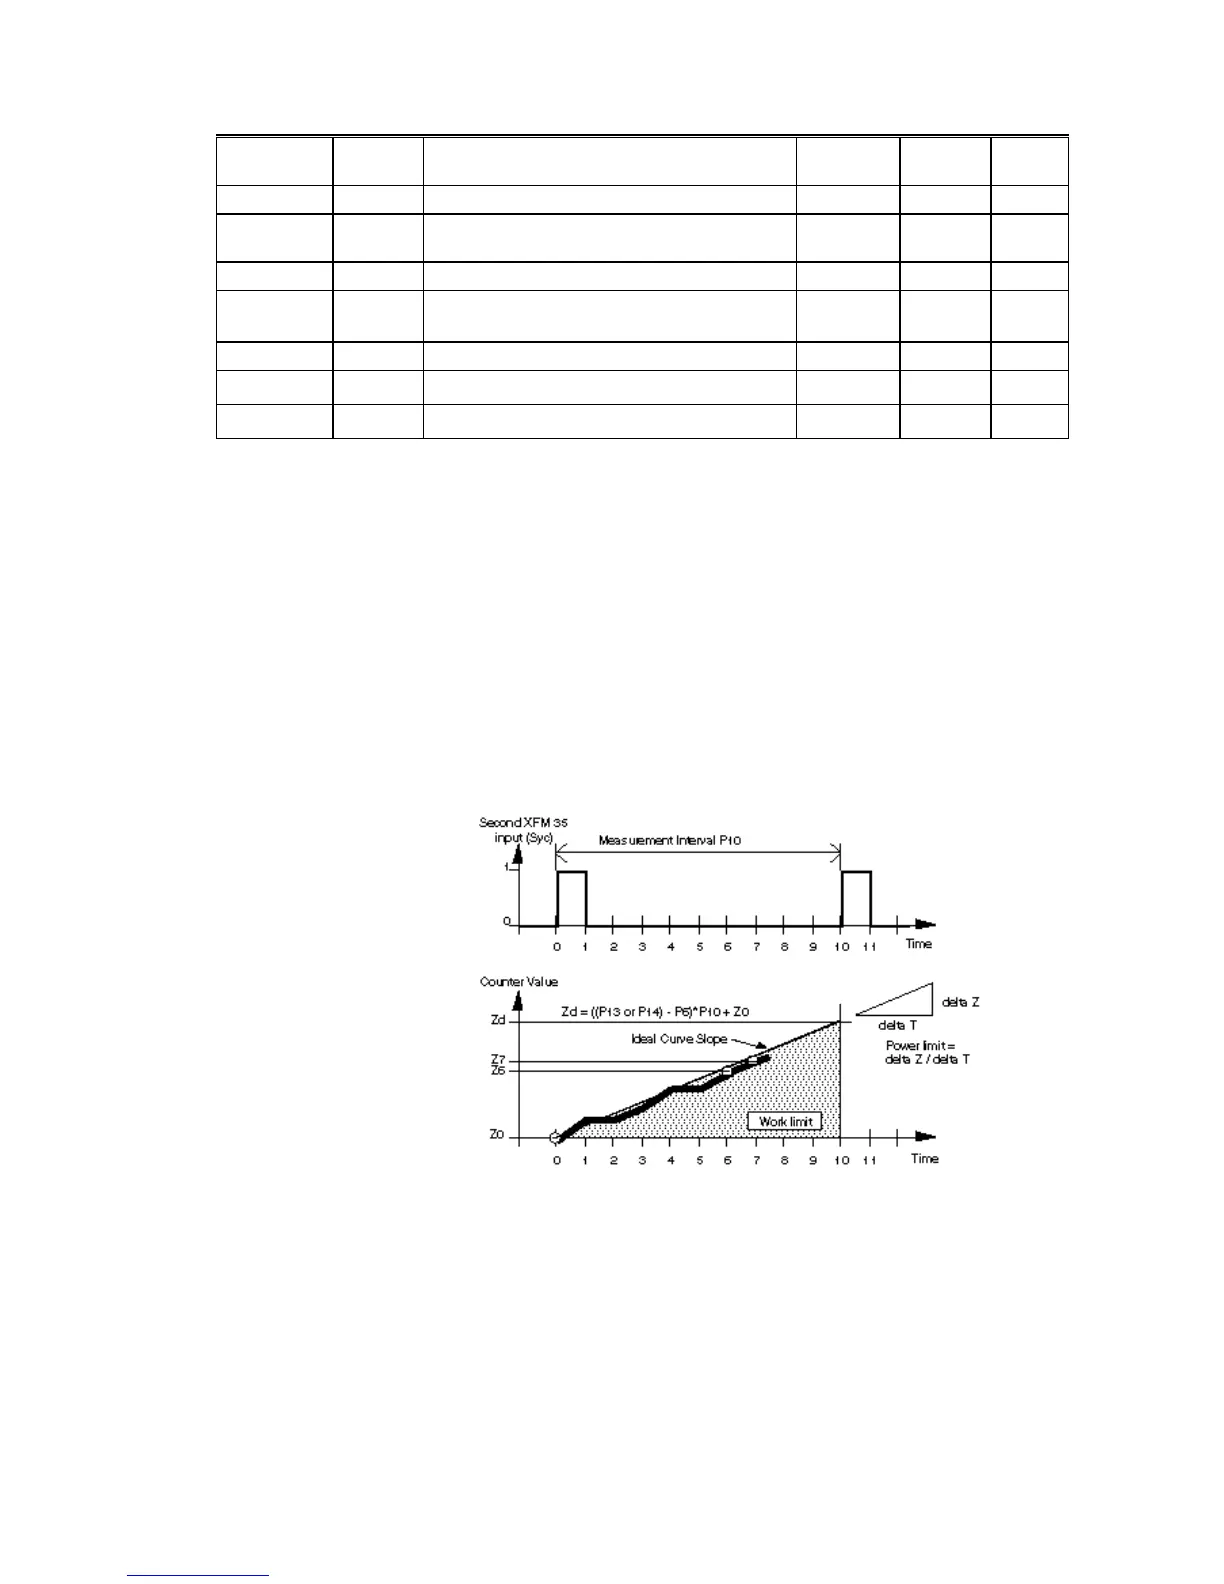
Ideal Curve Algorithm The Ideal Curve algorithm measures the increasing work and calculates the power
to be switched within a fixed measurement interval (Parameter P10). This
algorithm is used mainly in Europe.
Two synchronization pulses, received at XFM 35’s second input (Syc), determine
the start and finish of the measurement interval. The local electric company
provides the synchronization pulses. An agreement with the electric company
about energy consumption determines that consumed energy in a time interval
(measurement interval Parameter P10) shall not exceed a limit value that is the
product of power limit P13 or P14 and (P10)/60 in hours.
The following diagram shows measured power over runtime. The Ideal Curve
algorithm plots energy consumption along the power limit slope (Ideal Curve). The
algorithm uses three measured values (Z
0
, Z
6
, and Z
7
) to calculate the power
value to reach the ideal curve in Z
8
, Z
d
(the desired measurement value of power
at the end of the measurement interval).
Select the Ideal Curve algorithm by setting Parameter P9 to the value 2.
A safety margin parameter (P6) provides a secure margin between the current
power peak (Parameter P1) and the possible power (Parameter P4).

 Loading...