ALPHABETIC REFERENCE EXCEL CARE CONTROL ICONS
74-5577–33 (US) 100
EN2B-0184 GE51 R0518 (Europe)
The algorithm uses an offset factor (P18) to amplify the power setpoint (possible
power that displays in Parameter P4) at the beginning of every measurement
interval. The effect of the offset factor lessens as time passes and disappears by the
end of the measurement interval.
The internal user address IA___Energy_Intv indicates the current energy consumed
(equal to Z
7
- Z
0
in the previous diagram) during the measurement interval. The
General Functions subsection explains the other internal user addresses and
parameters used in this algorithm.
The following table lists the Ideal Curve algorithm parameters.
Parameter
Number
Type
Brief Description
Setting
Range
Default
Value
Unit
1 Display Current Power Consumption none none kW
2 Display Remaining Rest Time none none min
3 Display Remaining Work none none kWh
4 Display Possible Power with constant Power
Consumption
none none kW
6 Comm. Safety Margin 0-1000 0 kW
9 Comm. Measurement Algorithm
2=Ideal Curve
1/2/3 3 Integer
10 Comm. Measurement Interval/Window Size 1-7200 15 min
13 Comm. Power Limit 1
0-10
6
10000 kW
14 Comm. Power Limit 2
0-10
6
10000 kW
18 Comm. Offset Factor "a" (just for Ideal Curve Algorithm) 0-1000 0 Integer
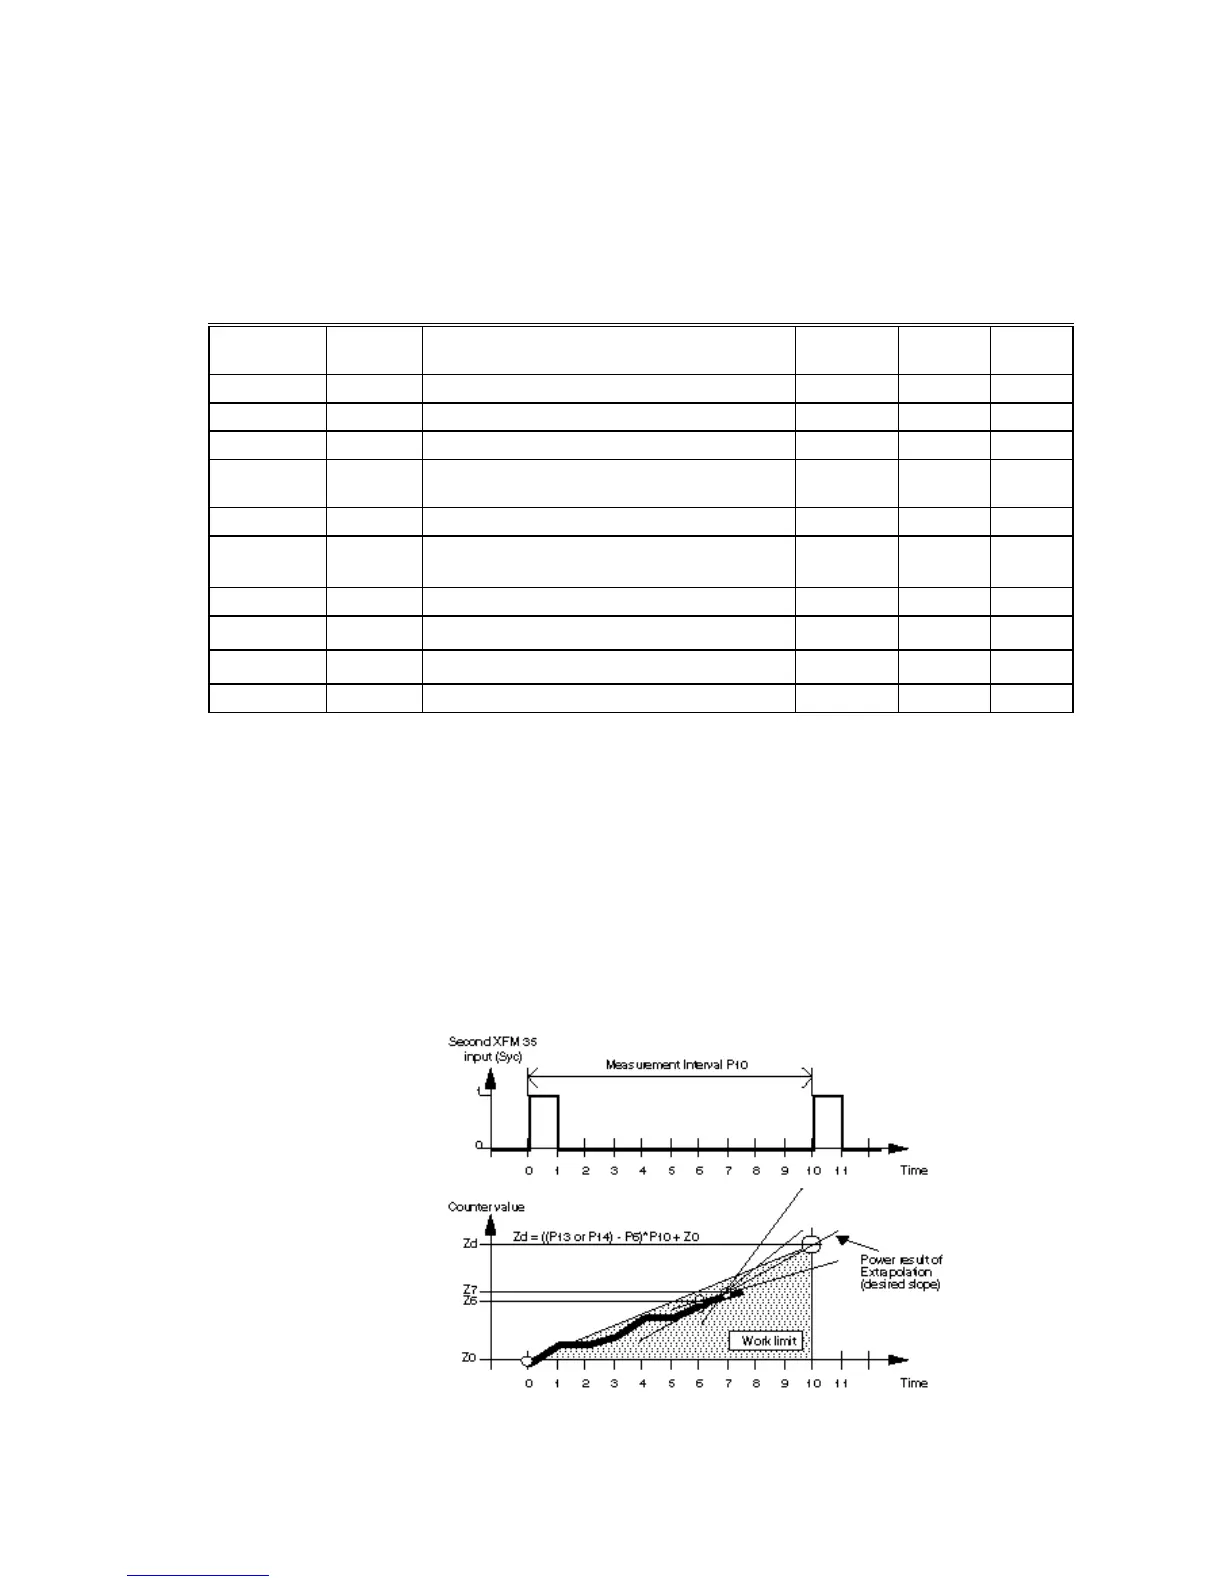
Extrapolation Algorithm The Extrapolation algorithm measures the increase in energy consumption and
calculates the power to be switched within a fixed measurement interval (Parameter
P10). This algorithm is used mainly in Europe.
Two synchronization pulses, received XFM 35’s second input (Syc), determine the
start and finish of the measurement interval. A local electricity company provides the
synchronization pulses. An agreement with an electricity company about energy
consumption determines that consumed energy in a time interval (measurement
interval Parameter P10) shall not exceed a limit value that is the product of power
limit P13 or P14 and (P10)/60 in hours.
The Extrapolation algorithm uses three measurement points to calculate the power
to be switched by the loads. The following diagram shows the power value at the 7th
sample in the measurement interval as a desired slope to reach the energy limit Z
d
.
The algorithm uses work values Z
0
, Z
6
, and Z
7
to calculate desired slope.

 Loading...