Front Panel Operation
2-8
Bar graph
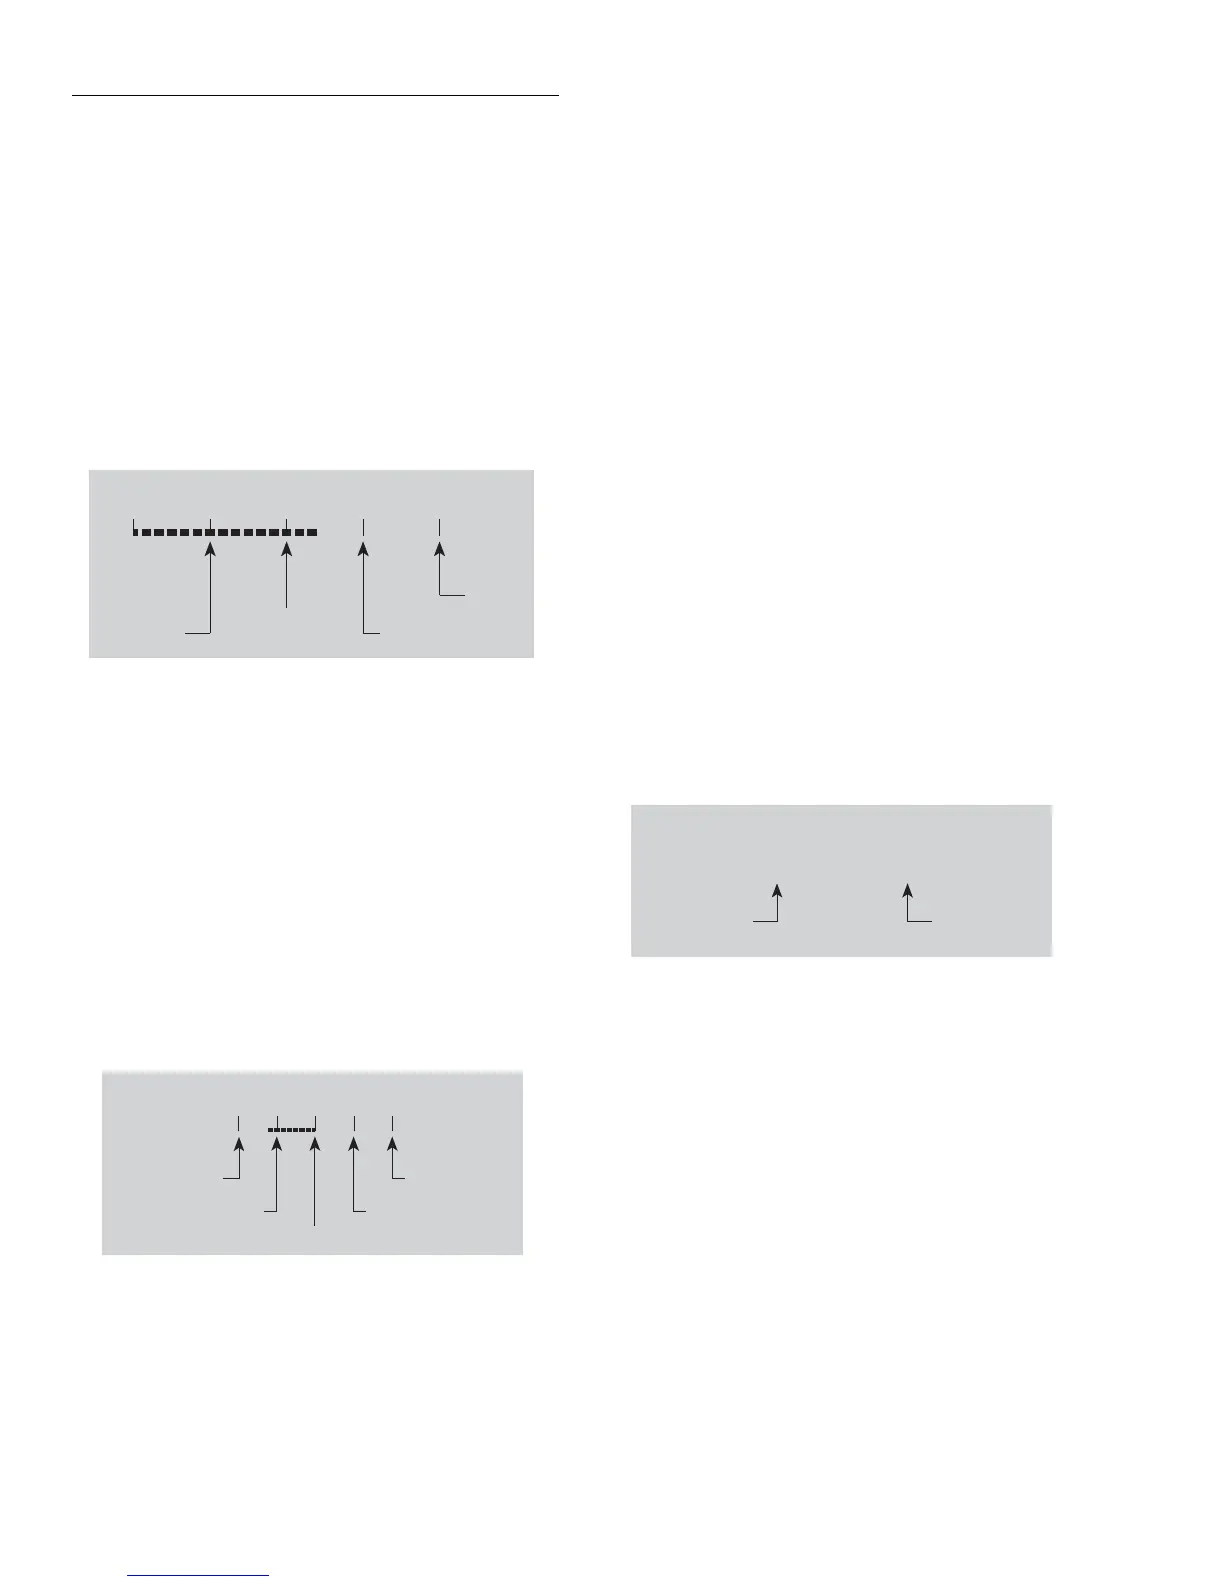
The “normal” bar graph, with a zero at the left end, is a
graphical representation of a reading as a portion of a range.
(See Figure 2-2.) The vertical lines displayed along the bar
designate 0%, 25%, 50%, 75%, and 100% of full scale. Each
full segment of the bar represents approximately 4% of the
range limit.
The right endpoint of the bar graph is plus full scale of the
present range for positive readings, and minus full scale for
negative readings. When the 100% line changes to an arrow,
the reading exceeds the present range.
Zero-centered bar graph
The zero-centered bar graph is a graphical representation of
a reading with plus and minus limits. (See Figure 2-3.) The
limits are expressed in a user-selectable percentage of range.
The vertical lines displayed along the bar designate the plus
and minus limits, zero, and halfway to either limit. There are
ten full segments between zero and each end, so each full
segment represents 10% of the limit. When a line at the limit
changes to an arrow, the reading exceeds the programmed
range.
The plus and minus percentage of range that is programmed
(0.01 - 99.99%) applies to all functions. Because of round-
ing, values greater than 99.5% are shown as 100% and, like-
Figure 2-2
Bar graph (zero-at-left) multiple display
-11.9685
0
-20V
Full
Range
25% of
full range
50% of
full range
75% of full range
V
Figure 2-3
Zero-centered bar graph multiple display
-05.9577
50%
+50V
-50% of range
-25% of range
25% of range
V
0%
+50% of range
wise, values greater than 1% (such as 1.67%) are shown
rounded to the nearest integer percent.
Perform the following to view or change the plus and minus
percentage of range:
1. From a measurement function, press CONFIG and then
NEXT or PREV DISPLAY. The following is displayed:
ZERO-BARGRAPH+/-50.00%
2. Change the percentage by using the cursor keys and the
RANGE ▲ and ▼ keys to enter a numeric value (0.01 -
99.99%). Press ENTER when done.
Maximum and minimum
The maximum and minimum multiple display shows the
maximum and minimum readings since the display was en-
tered. (See Figure 2-4.) The maximum and minimum values
are reset by the following:
• Pressing the present function key.
• Leaving the display by changing function or entering a
menu.
The resolution, units, and prefix on the bottom line are the
same as shown for top line reading.
Relative humidity and external temperature
This display provides the relative humidity and the external
temperature readings. Note that the appropriate sensors have
to be connected to instrument, and they have to be enabled in
order to get valid readings. (See paragraph 2.22 for details.)
2.3.5 Navigating menus
There are basically two types of menu structures; the Main
Menu and the Configure menus. The Main Menu accesses
items for which there are no dedicated keys, and Configure
menus are used to configure measurement functions and oth-
er instrument operations.
Figure 2-4
Maximum and minimum multiple display
-15.8286
Max = -05.7460
Min = -15.8286
Minimum
value
Maximum
value
V
 Loading...