4-12
4.5.1.3 Interval
In the Tabular Trend window, you can set [Interval] to [1min], [5min], [10min], [15min],
[30min], [1h], and [2h].
4.5.1.4 Display Group
In the Tabular Trend window, you can set [Display Group] to [Pressure], [Volume], [Time],
[Gas], [SpO
2
], [Other], and [All].
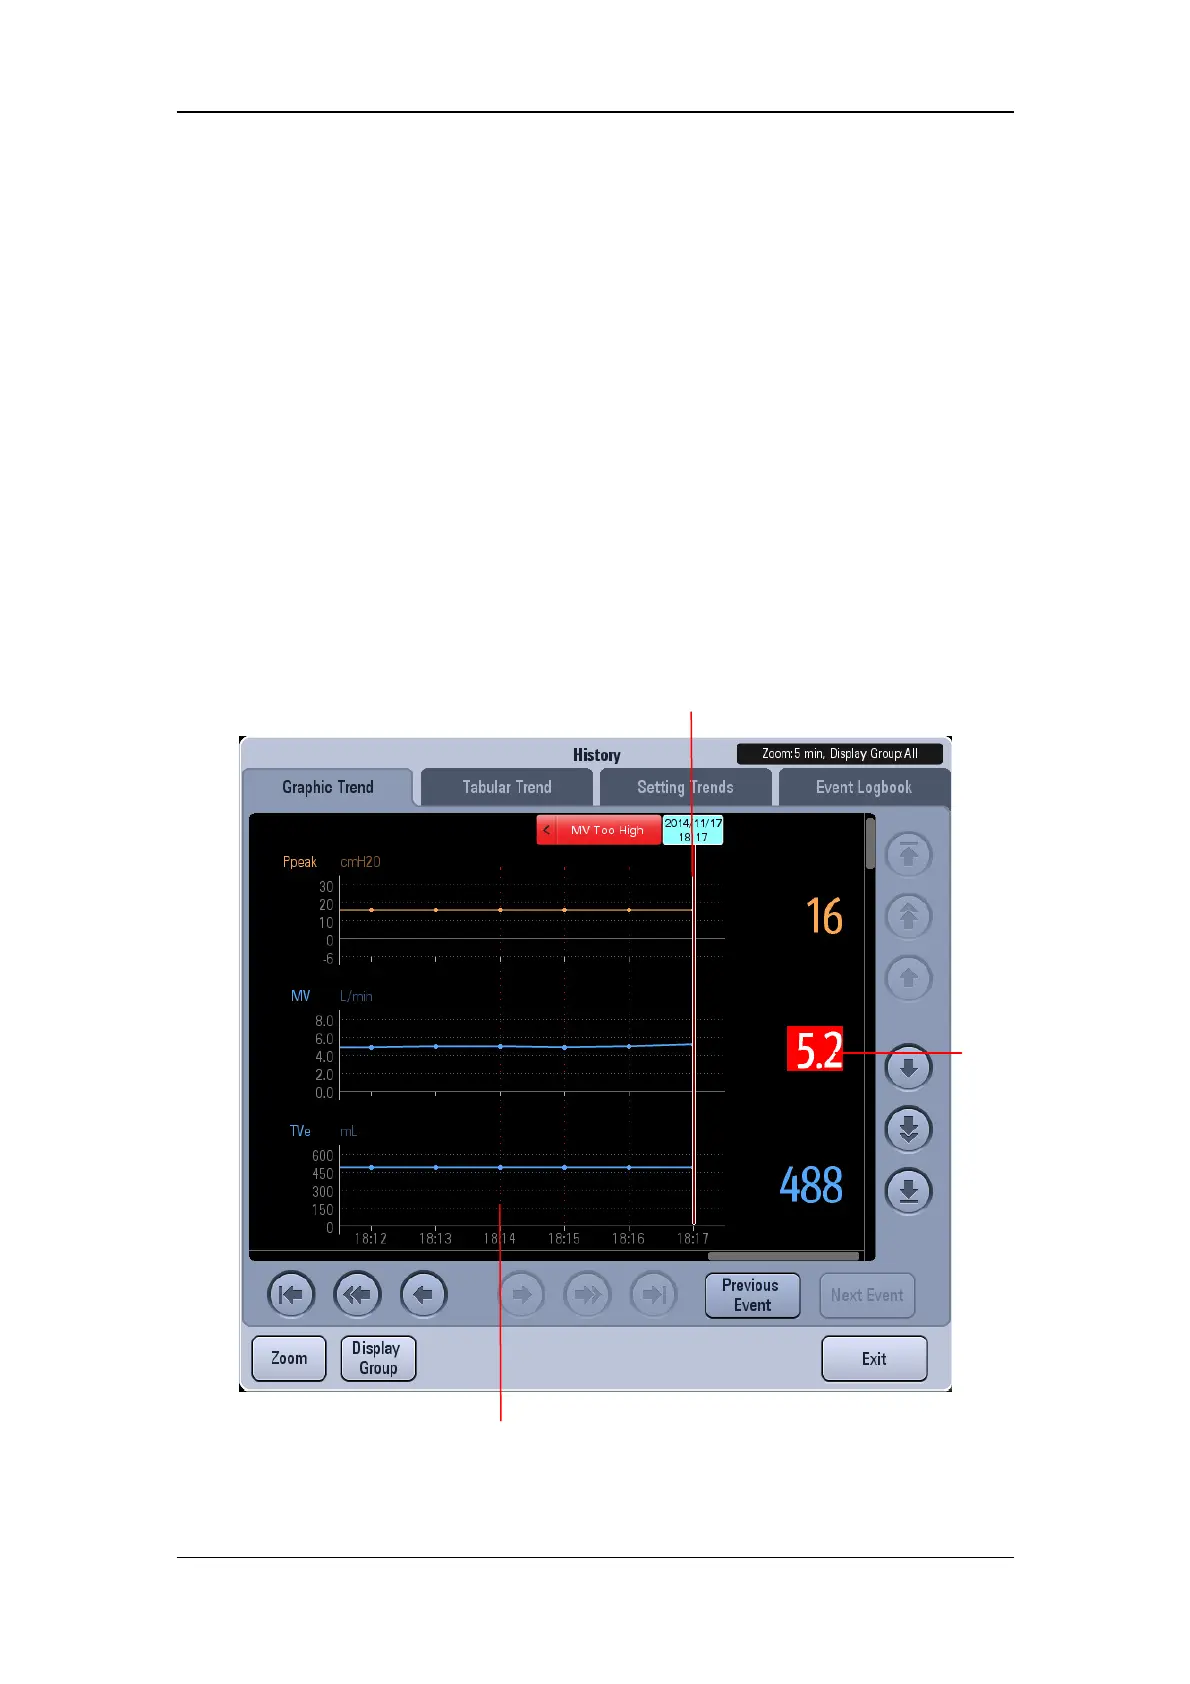
4.5.2 Graphic Trend
Graphic trend records the trend of parameter values. It is reflected through a curve. Every
point on the curve corresponds to the value of physiological parameter at a specific time point.
Graphic trend also records parameter alarm events. Graphic trend data displays at one-minute
intervals by default unless the zoom is selected.
Current cursor. The corresponding time displays above the cursor. If alarms occurred at
that time, the corresponding alarm information will also be displayed above the cursor.
The parameter
data of the
time indicated
by cursor.
Event marker. The dotted, colored line indicates a parameter alarm event
occurred at that time. A parameter alarm event is indicated by a dotted line
in the same color with alarm. If multiple events occurred, the dotted line is
in the same color of the highest level alarm.
 Loading...