5 – Managing Ports
Graphing Port Performance
5-26 59097-02 B
S
5.6.7.3
Customizing Graphs
You can customize the graph polling frequency, what is plotted in the graphs, and
the graph color scheme. To set the polling frequency for all graphs, open the
Graph menu and select Set Polling Frequency.... Enter an interval in seconds
(0–60) in the dialog box and click the OK button.
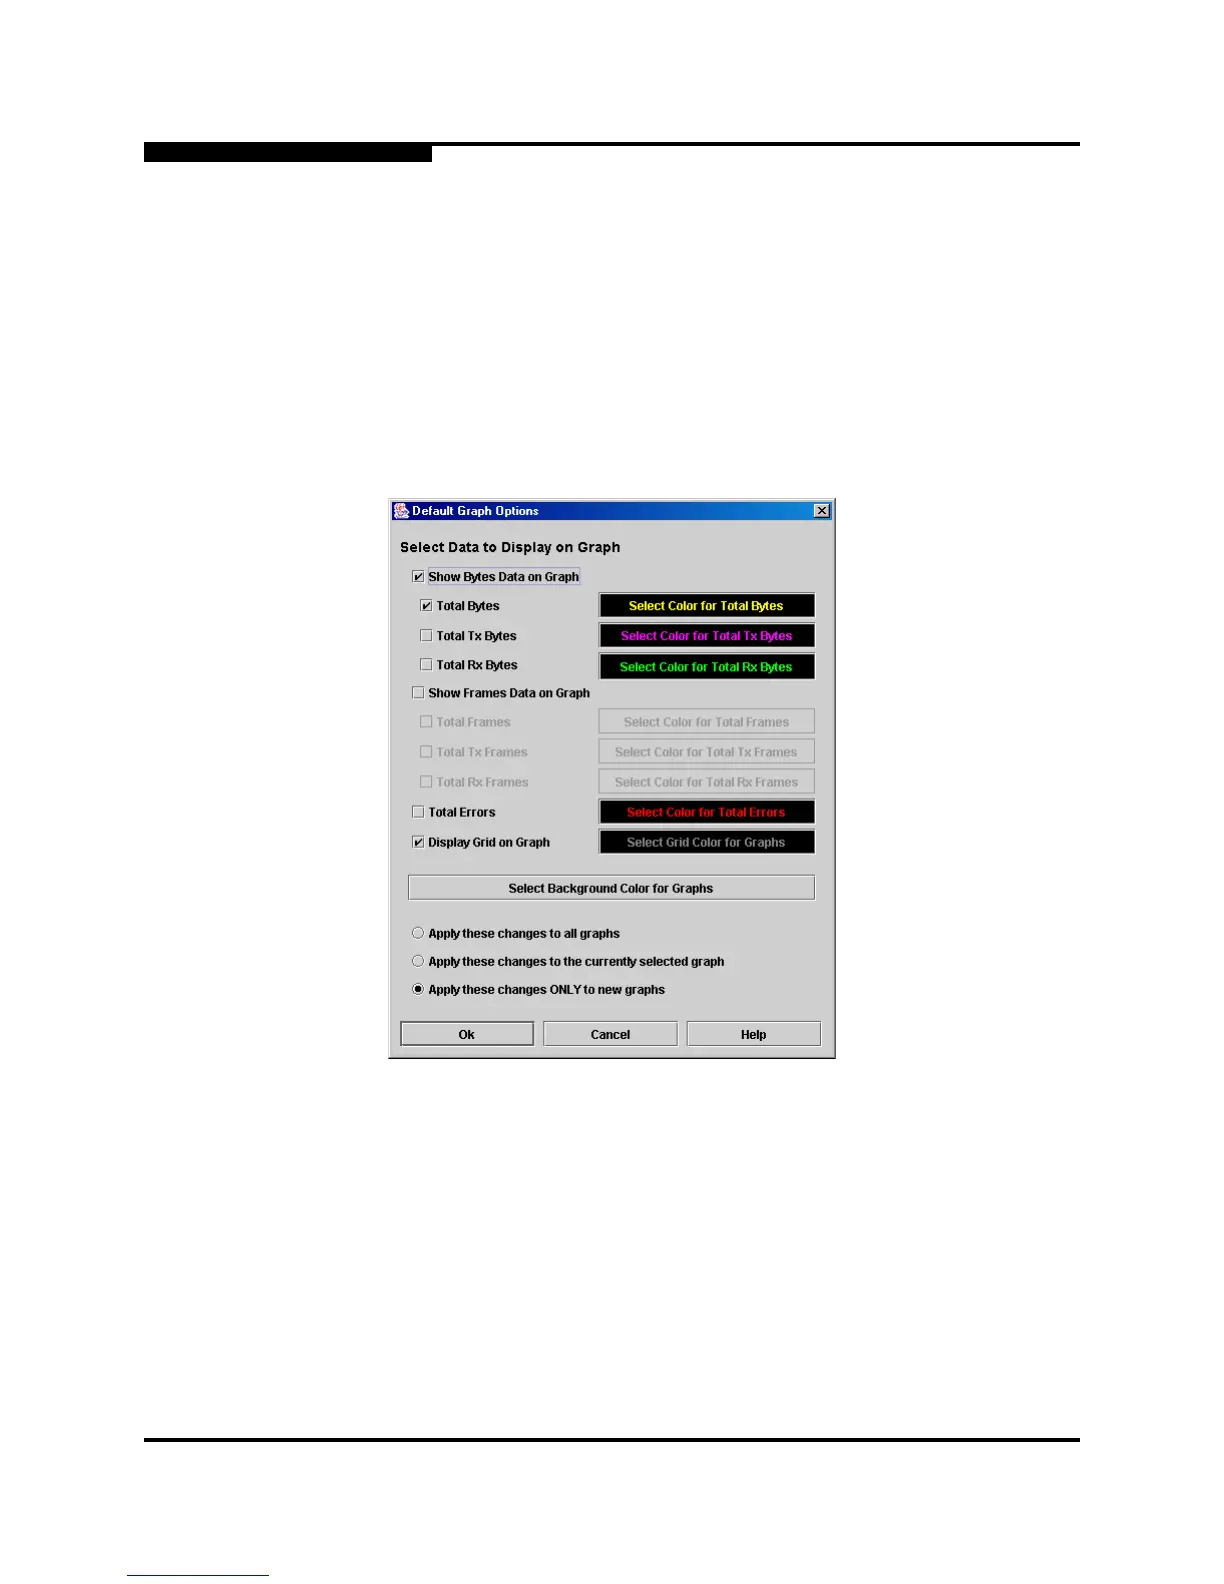
To choose what is to be plotted, open the Graph menu and select Modify Graph
Options.... You can also right click on a graph and select Change Graph
Options. This opens the Default Graph Options dialog shown in Figure 5-9.
Figure 5-9. Default Graph Options Dialog
To modify the graph options, do the following:
1. Choose the units for the graph:
Select the Show Bytes Data on Graph check box to plot data in
KBytes/second
Select the Show Frames Data on Graph check box to plot data in
frames/second.
 Loading...