26.3Weatherapplicationdisplay
overview
Theweatherapplicationdisplaysarangeof
graphicstoindicateweatherconditionsandforecast
information.
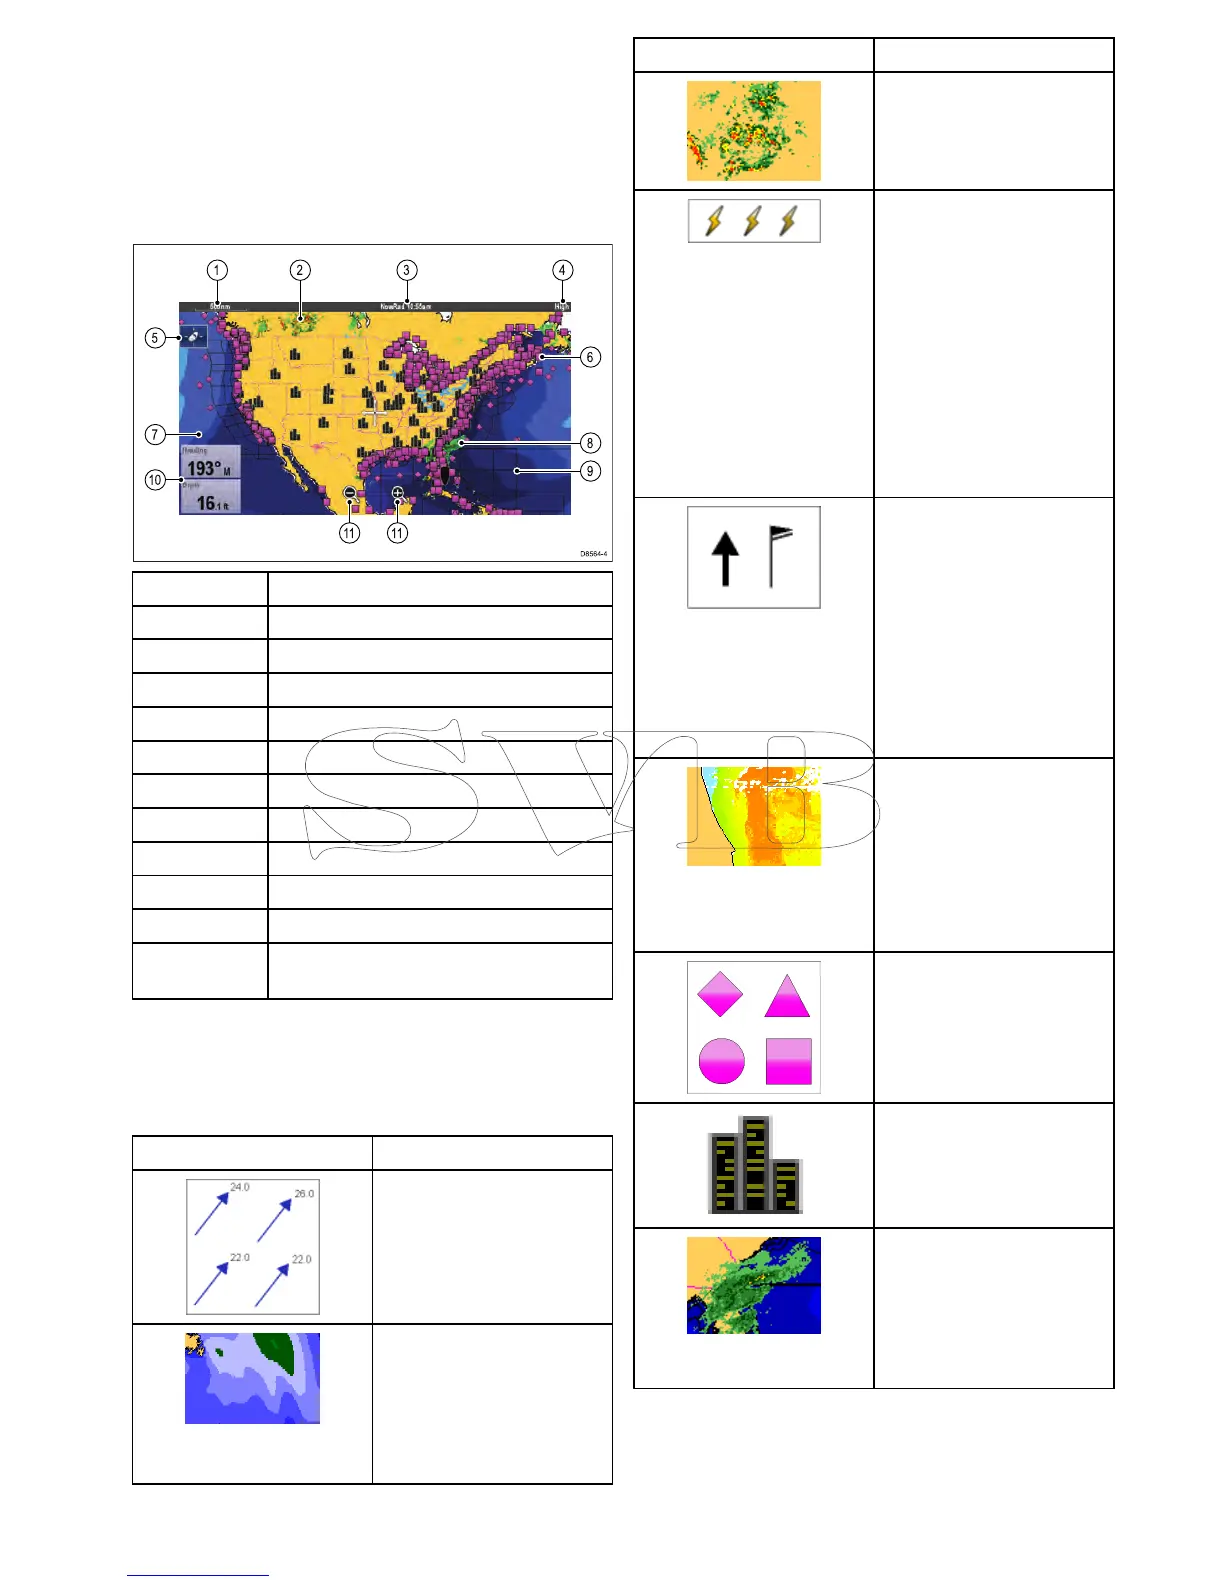
Thefollowingdiagramillustratesthemainfeatures
oftheweatherapplicationdisplay:
ItemDescription
1Range
2
Canadianradar
3
Animationandtime/date
4
Signalstrength
5
Findshipicon
6
Surfaceobservationstations
7
Waveheights
8
NOWRad
9Marinezones
10Dataoverlaycells
11
On-screenRangeinandouticons
(Touchscreendisplaysonly)
Weathersymbols
Theweatherapplicationusesarangeofgraphics
andsymbolstorepresentdifferentweather
conditionsandforecasts.
SymbolDescription
Stormcast(darkblue)arrows
indicatingdirectionandspeed
ofastorm.
Waveheight
•Highestwaves(red)
•Intermediatewaves
(greens)
•Lowestwaves(blues)
SymbolDescription
Canadianradar(darkgreens,
yellow,orangeandred)
Lightning—alightning
symbolisshownateach
cloud-to-groundstrike:
•Light(recordedinlast
10–15minutes.)
•Medium(recordedinlast
5–10minutes.)
•Dark(recordedinlast0–5
minutes.)
Morerecentstrikesare
overlaidoveroldersymbols.
Wind—Windsymbolsshow
thecurrentwinddirectionand
strengthandcanbedisplayed
aseitheranarroworawind
barb.Windarrowsindicate
speed—thelargerthearrow,
thegreater(stronger)the
windspeed.Windbarbsgive
amorepreciseindicationof
windspeedasshowninthe
windspeedsymbolssection.
Seasurfacetemperature
(green,yellowandorange)
•Blue—coldest
•green
•yellow
•orangeandred—warmest
Surfaceobservationstations
(pink)—Currentorhistorical
weatherdatacanbeviewed
atsurfaceobservation
stations.Notalldatais
availableforallstations.
Cities—Thecitysymbols
enablesyoutoaccessdetails
ofcityweatherforecasts.Up
to3forecastsaredisplayed
foreachcity.
NOWRad
•Rain(green,yellowand
red.)
•Snow(blues)
•Mixture(pinks)
Weatherapplication(NorthAmericaonly)
385
 Loading...