4-46
IM 04L42B01-01E
Explanation
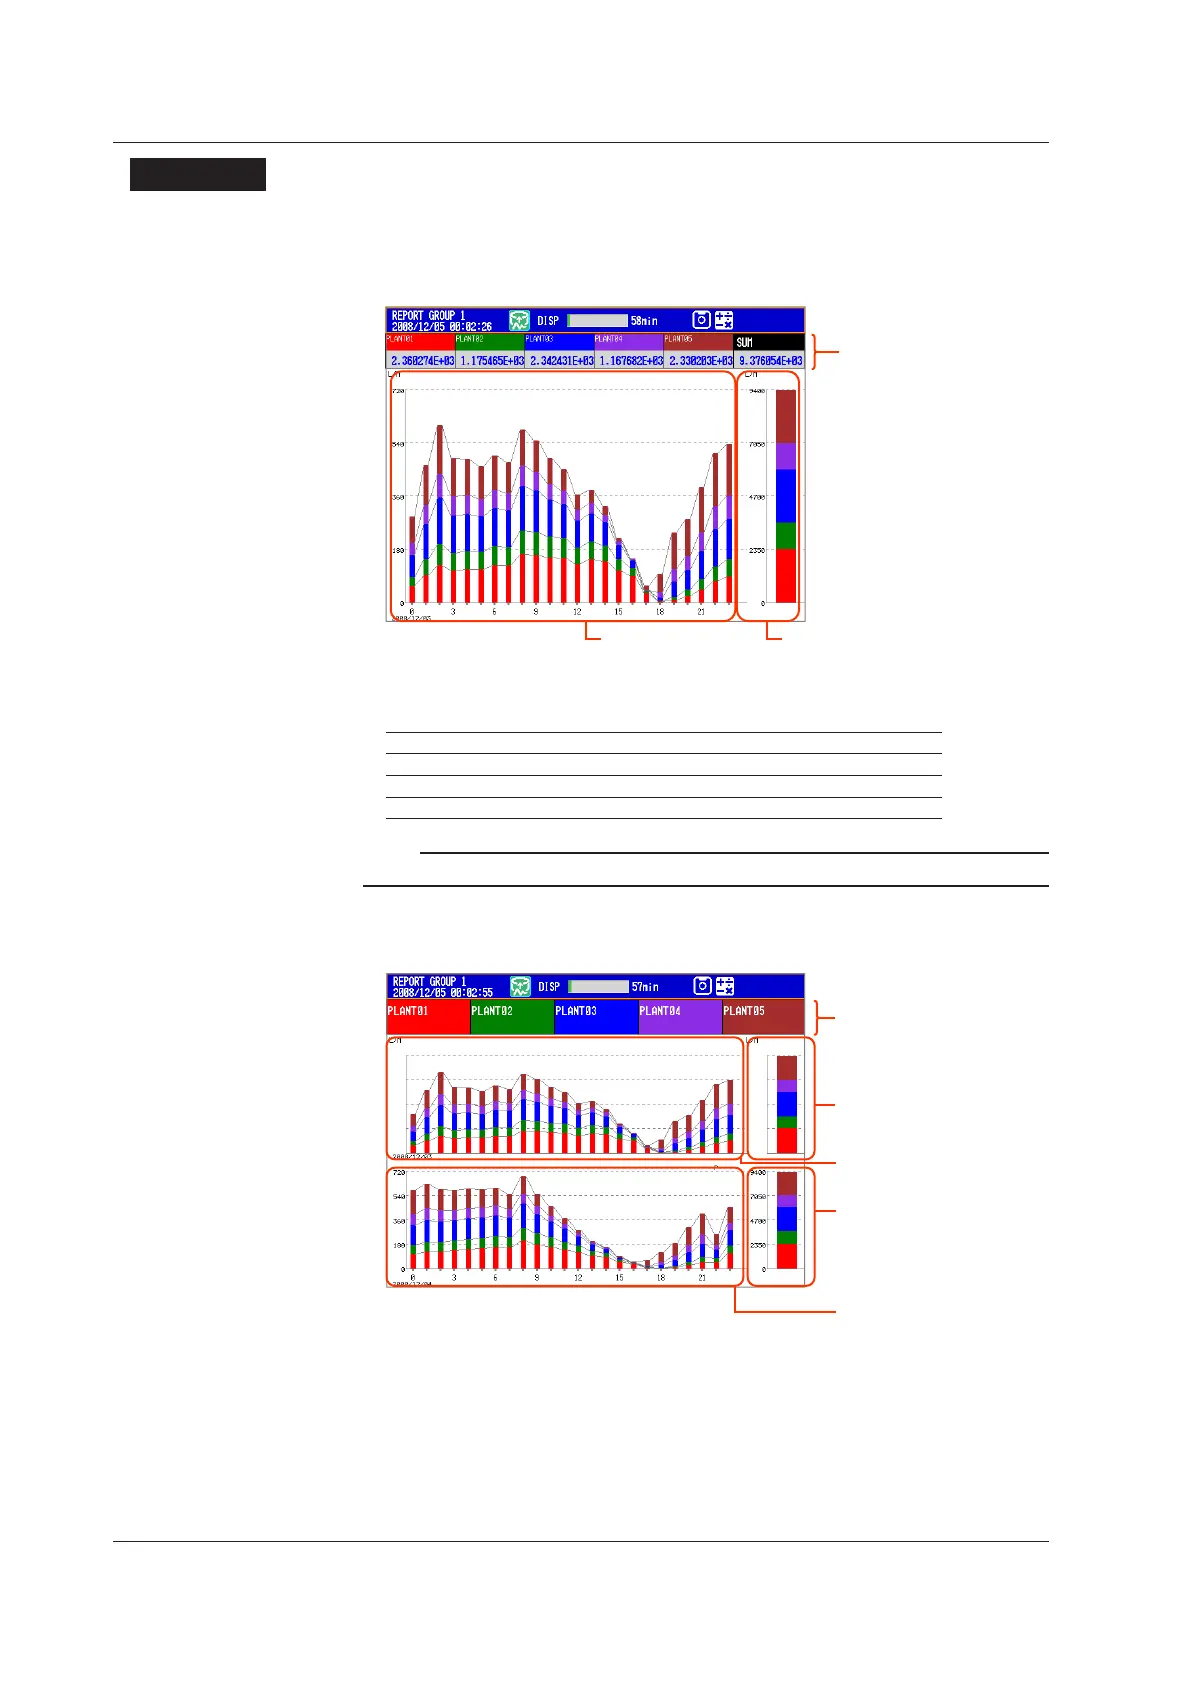
• SINGLEGRAPH/DUALGRAPH
You can display one or two bar graphs. The sums of the first channel in a group and of
all other channels that have the same unit as it are displayed.
• SINGLEGRAPH
display
section
Display area 1
Display area 2
The displayed report data varies depending on the report kind, which is set using
the report function.
Reportkind DisplayArea1 DisplayArea2
Hourly, H+D Sums for each hour Sums for the day
Day+Week Sums for each day Sums for the week
Daily, D+M Sums for each day Sums for the month
Note
In 4-panel display, the numeric display section only contains channel numbers or tags.
• DUALGRAPH
Shows the data from two consecutive periods at the top and bottom of the display.
Channel number or tag
Display area 2
Display area 4
Display area 3
The displayed report data varies depending on the report kind, which is set using
the report function. Display areas 1 and 2 contain the same report data listed above
for SINGLE GRAPH display.
4.11DisplayingStackedBarGraphs(/M1and/PM1options;releasenumber3orlater)
 Loading...