Patient Monitor User Manual Review
- 186 -
Chapter 21 Review
The monitor provides 120-hour trend data of all parameters, storage of 1200 NIBP measurement
results, 200 alarm events, 200 arrhythmia events, 24 hours OxyCRG and 50 sets of 12-lead
analysis results. This chapter gives detailed instruction for review of all data.
21.1 Trend Graph Review
To review the trend graph, please press the
Trend Graph
key on the screen or select
Menu
>
Review
>
Trend Graph
.
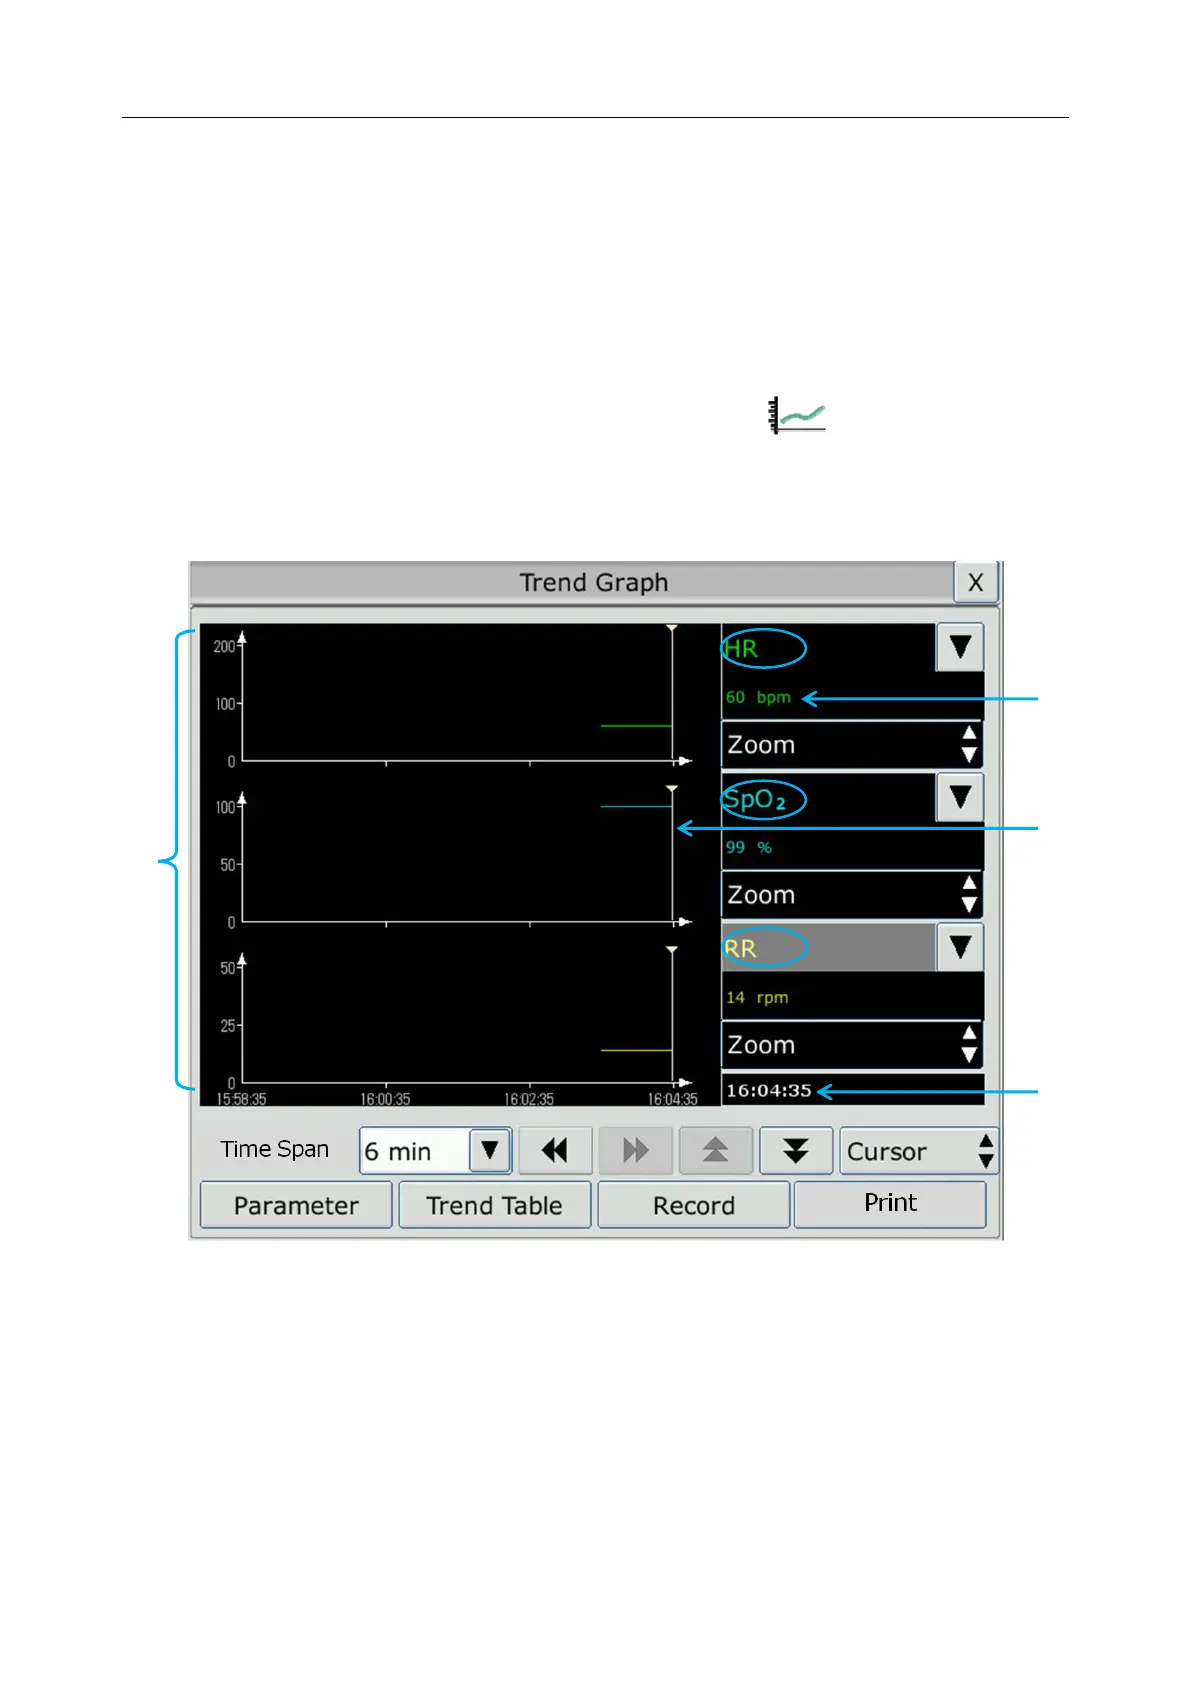
In the trend graph, the y-axis stands for the measurement value and x-axis stands for the time.
With the exception of NIBP, other trends are displayed as continuous curves.
1 Trend curve area
2
Trend data: displays measurement values at the cursor indicated time.
3
Cursor
4
Cursor time
In the trend graph review window:
■
Select Parameter and you can choose the required parameters to be displayed in the trend
graph.
4
3
2
1
 Loading...