34
CTV-SVU01G-EN
Changing the Scales on Data Graphs
CChhaannggiinngg tthhee SSccaallee ooff tthhee XX--aaxxiiss
The X-axis scale defaults to the most recent 60 minutes with 15 minutes in between the time
labels that appear across the bottom of the graph. You can change the scale from the last 12
minutes to the last 2 days and increments in between, as follows:
• 12-minute graph with 3 minutes between time labels
• 40-minute graph with 10 minutes between time labels
• 60-minute graph with 15 minutes between time labels
• 4-hour graph with 1 hour between time labels
• 8-hour graph with 2 hours between time labels
• 1-day graph with 6 hours between time labels
• 2-day graph with 12 hours between time labels
To change the scale, touch the plus or minus button in the magnifying glass in the lower left
corner of a data graph that you want to edit (for an example, refer to the figure in “Viewing Data
Graphs,” p. 33). The slider scale moves to the right or left as you touch either the plus or minus
button. The time scale for the X-axis changes in response.
CChhaannggiinngg tthhee SSccaallee ooff tthhee YY--aaxxeess
The Y-axes scales have a default range that varies for each data graph. You can change the range
for each graph.
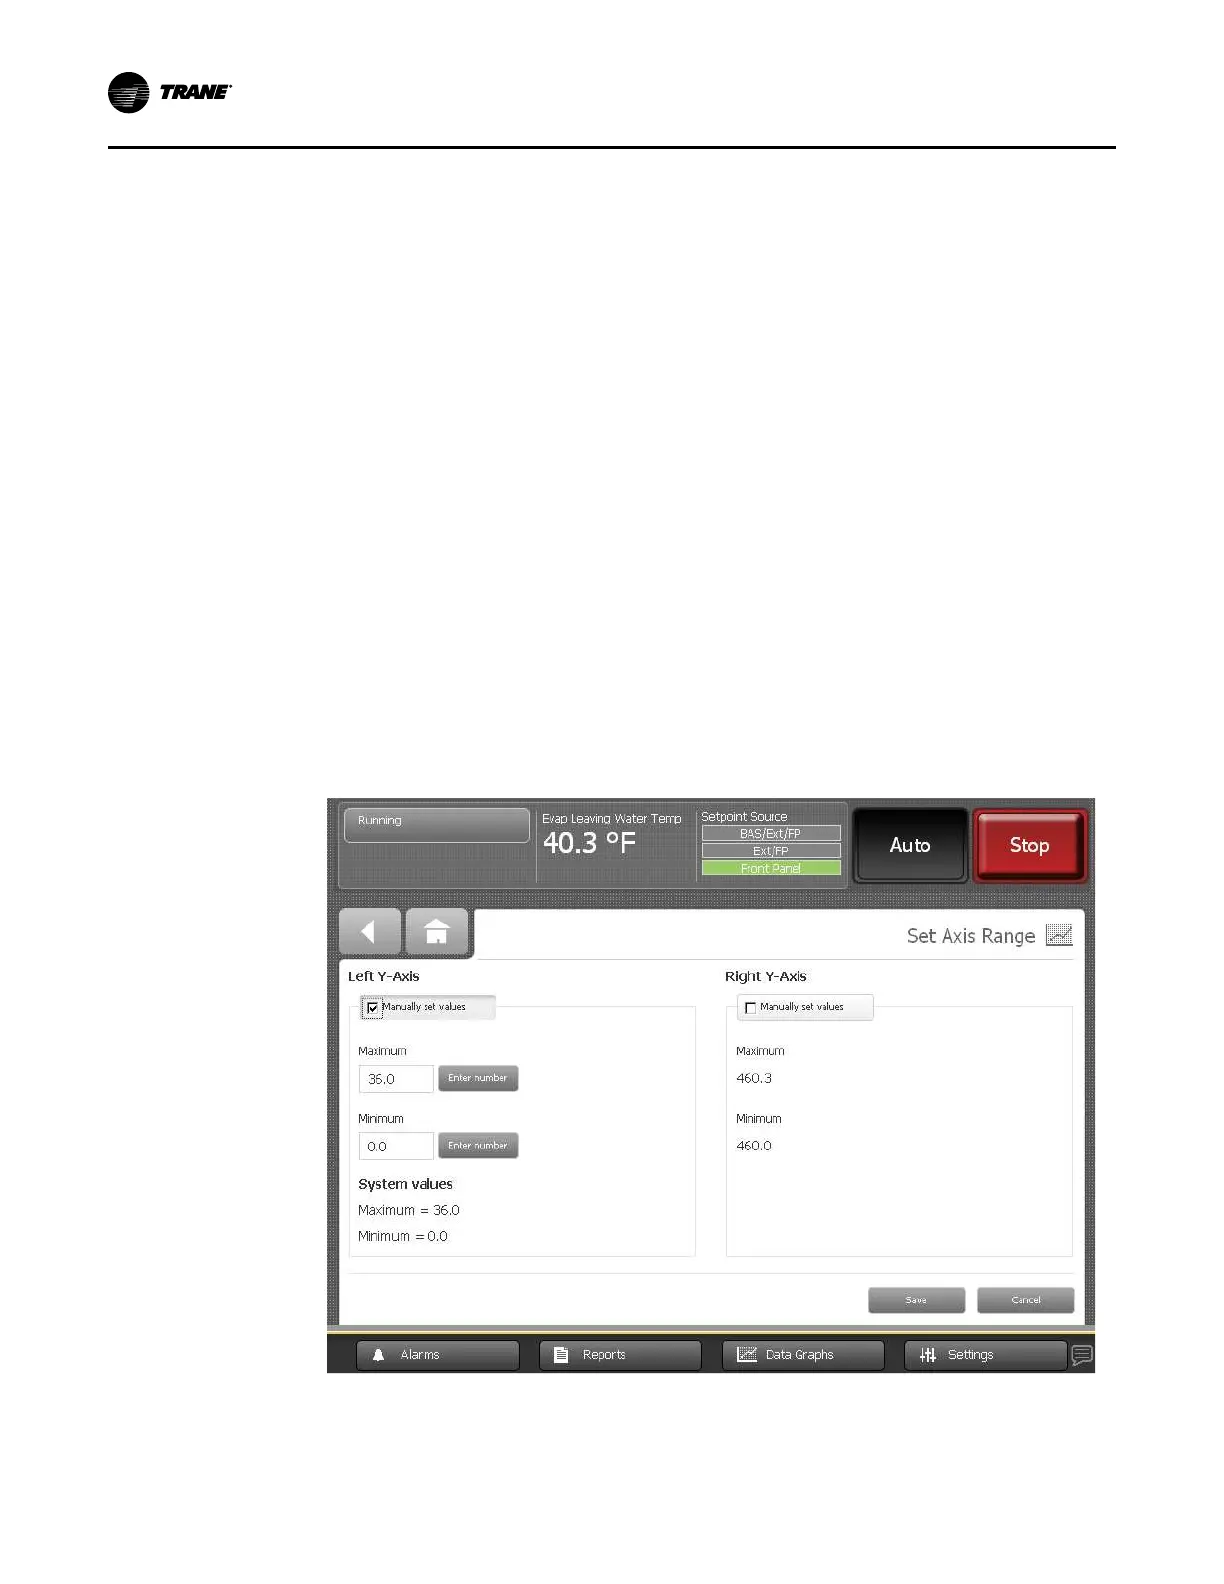
1. Touch the EEddiitt YY--AAxxiiss button at the bottom of a data graph that you want to edit (for an
example, refer to the figure in “Viewing Data Graphs,” p. 33). The Set Axis Range screen
appears in the following figure. The screen shows the minimum and maximum values for
that particular graph.
Figure 16. Set Axis Range screen
2. Touch the MMaannuuaallllyy sseett vvaalluueess button under either the Left Y-Axis or Right Y-Axis heading.
EEnntteerr nnuummbbeerr buttons appear to the right of the minimum and maximum values.
3. Touch the EEnntteerr nnuummbbeerr button for the value you want to change. A keypad appears on the
DDaattaa GGrraapphhss
 Loading...