CTV-SVU01G-EN
37
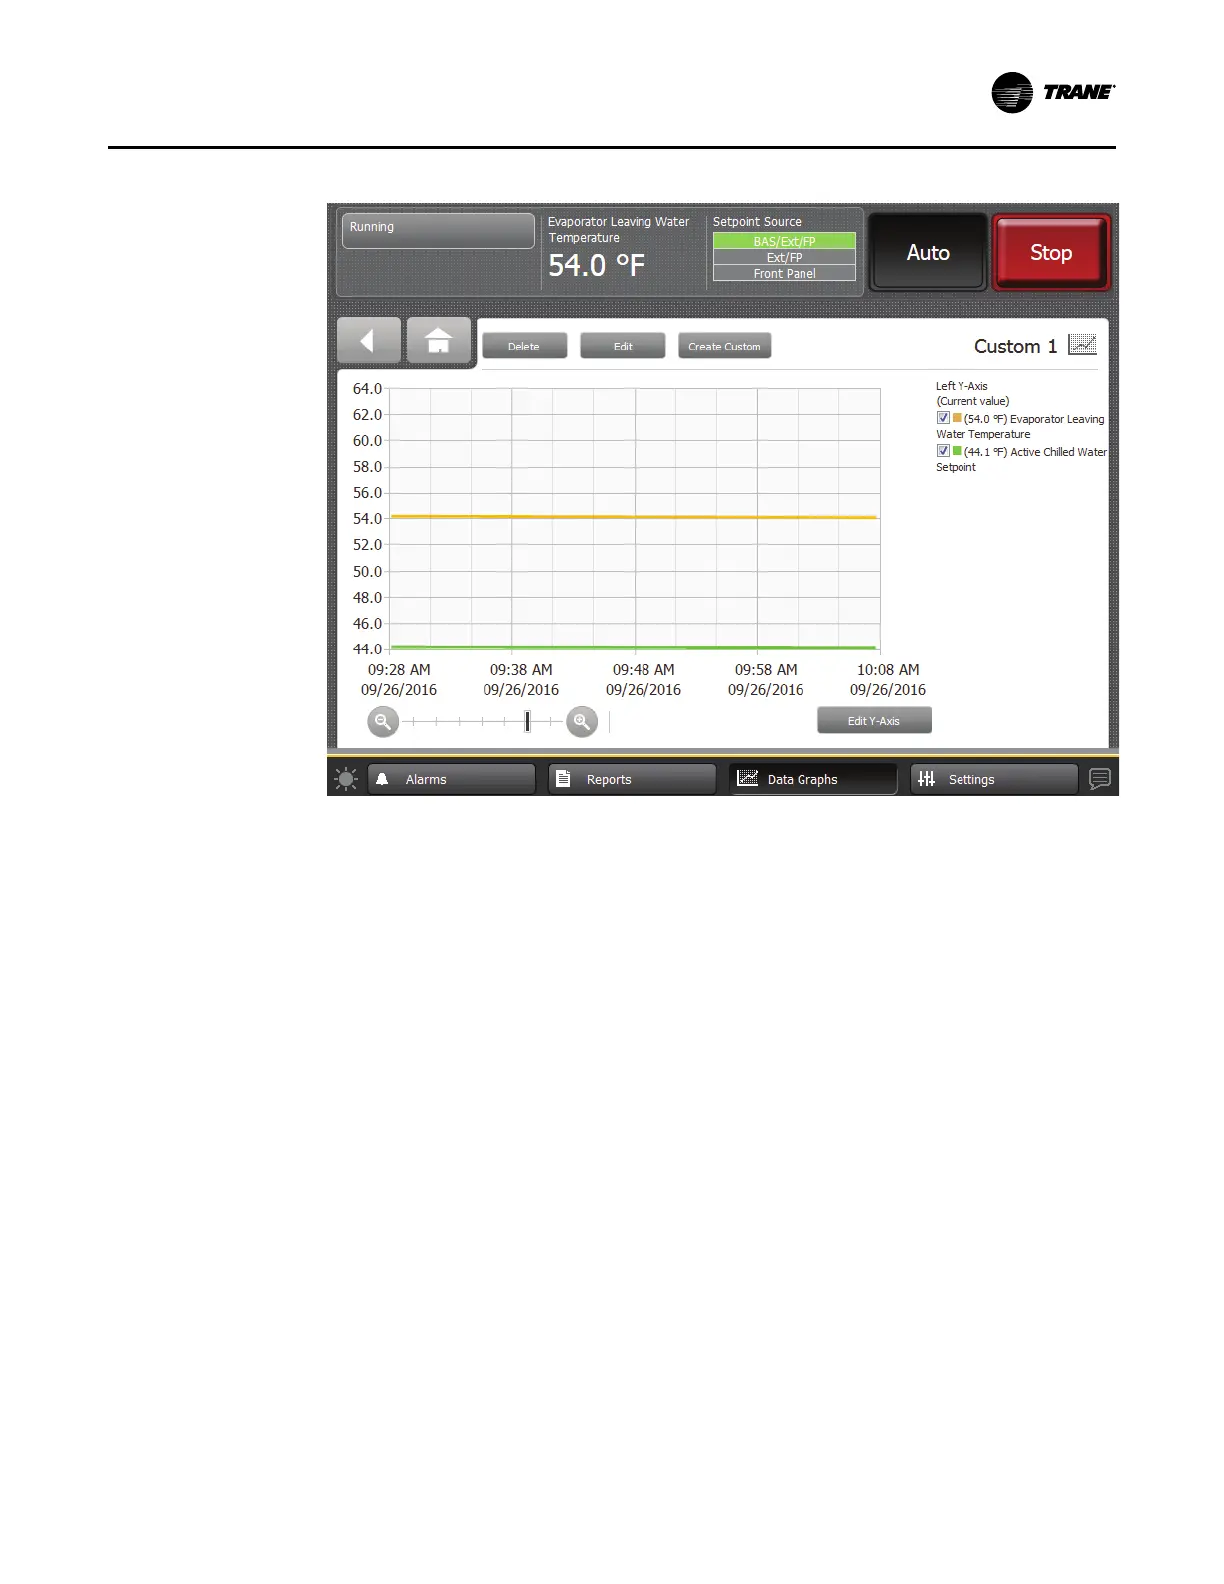
Figure 19. Custom data graph example
Creating a Custom Data Graph With No Previously Defined Data Graph Points
1. Touch the CCrreeaattee CCuussttoomm button at the top left of the Data Graphs screen (Figure 14, p. 32).
The Add/Remove screen appears (see ), but with no data on the screen.
2. Continue by following Step 3 through Step 5 in “Creating a Custom Data Graph From a
Default Data Graph,” p. 35.
Editing Custom Data Graphs
You can edit custom data graphs by:
• Changing the scales of the X-axis and Y-axes (follow the procedures in “Changing the Scales
on Data Graphs,” p. 34 ).
• Changing the:
– Line style between bold and normal
– Y-axis location between left and right
– Line color
1. To edit a data point, touch the EEddiitt button in the row for the data point you want to edit. The
Edit Data Point screen appears (refer to the following figure).
2. Touch the button in each category—Line Style, Y-Axis, Color—that represents how you want
the graph to appear. The buttons you select become shaded.
3. Touch SSaavvee. The screen you were previously viewing appears with your changes reflected in
the table.
DDaattaa GGrraapphhss
 Loading...