CTV-SVU01G-EN
35
screen.
4. Touch the appropriate numbers to change the current value. The new value appears above
the keypad.
5. Touch the EEnntteerr button. The graph you were previously viewing appears with changed
maximum and/or minimum values.
6. Touch SSaavvee. The data graph appears with changed Y-axes scales.
Creating Custom Data Graphs
You can create a custom data graph in two ways:
• By starting with a default data graph
• By starting from a blank screen, with no previously defined data graph points
Creating a Custom Data Graph From a Default Data Graph
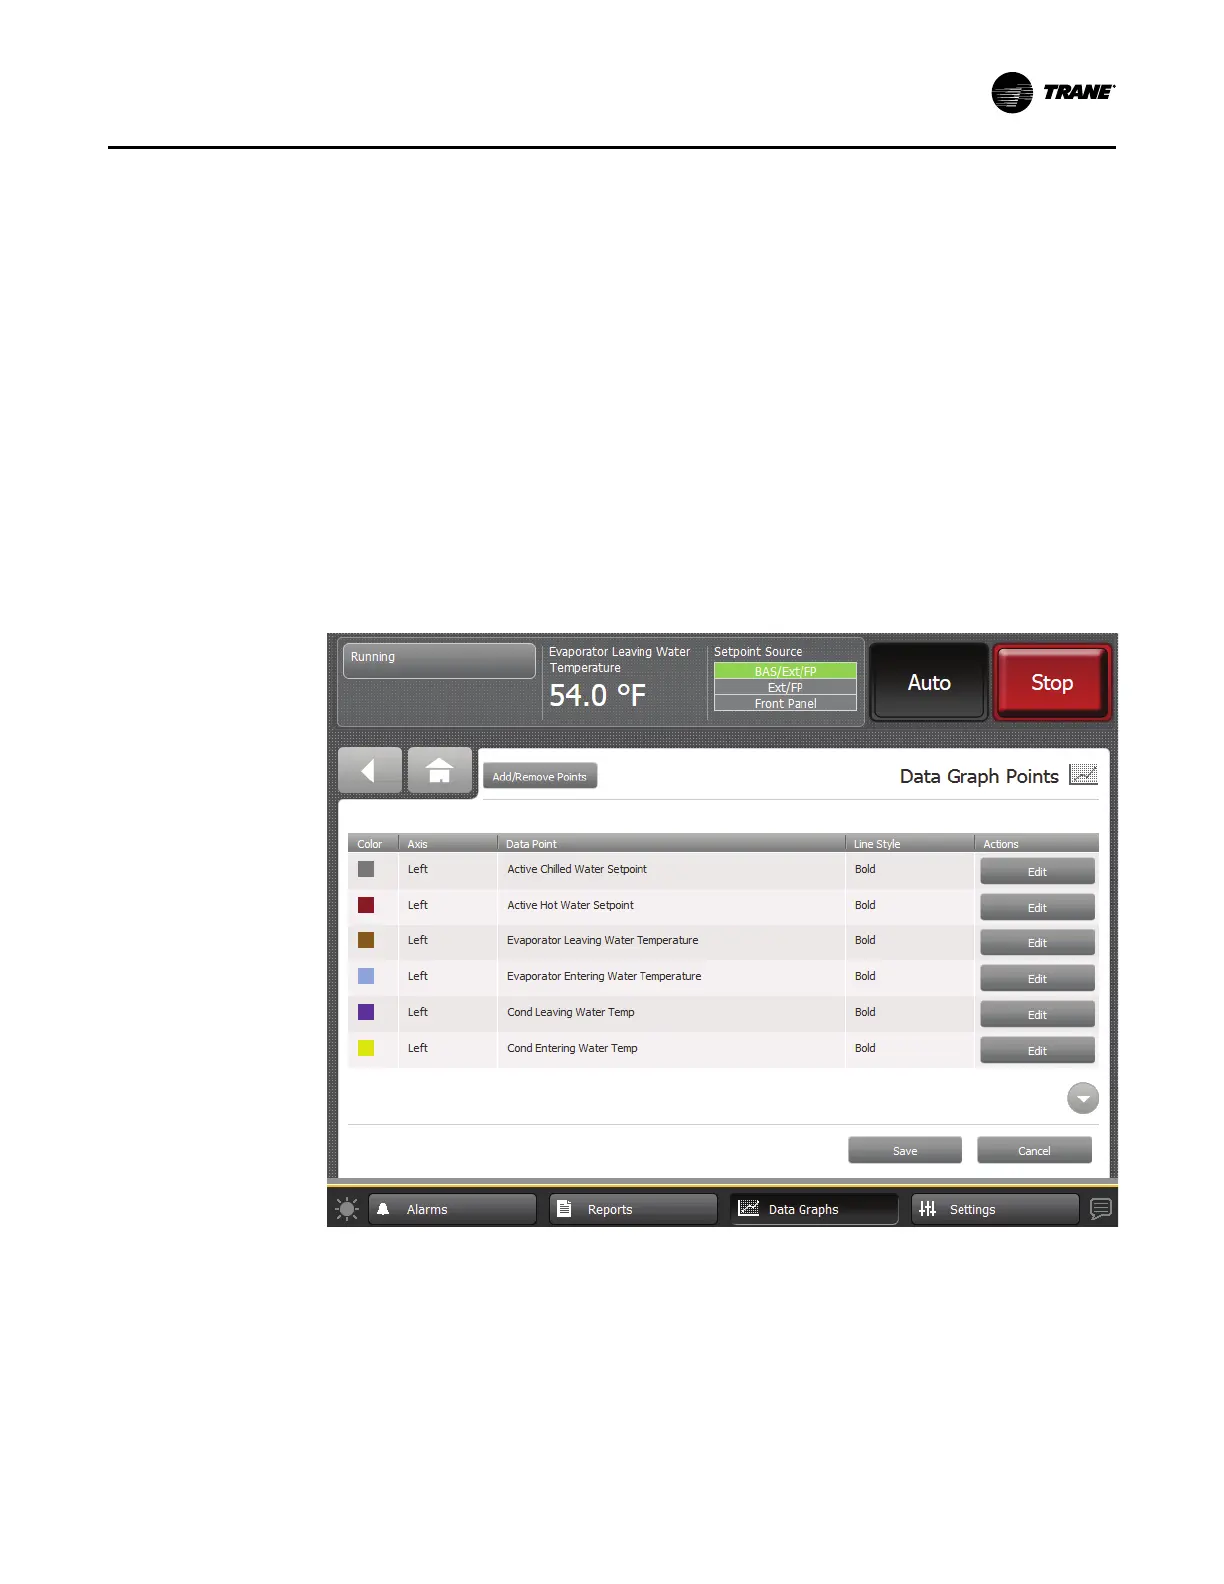
1. Touch the CCrreeaattee CCuussttoomm button at the top left of any default data graph screen (for an
example, refer to the figure in “Viewing Data Graphs,” p. 33). The Data Graph Points screen
appears as shown in the following figure.
Figure 17. Data Graph Points screen
2. Touch the AAdddd//RReemmoovvee PPooiinnttss button at the top left of the screen. The Add/Remove screen
appears (refer to the following figure), pre-populated with data points from the default data
graph you chose.
NNoottee:: When you save the graph, a new custom graph is created; the default data graph is not
overwritten.
3. Touch the up/down arrows at the top of the left box on the Add/Remove screen to scroll
through a list of chiller components. The list of items in the box just below the up/down
arrows changes to correspond to the component choice. (For reference, these items are listed
in “Appendix A: Data for CenTraVac Simplex Chillers,” p. 63 and “Appendix B: Data for
DDaattaa GGrraapphhss
 Loading...