User's Manual 21. Diagnostics and Performance Monitoring
Version 4.4.3 339 MP-20x Multimedia Home Gateway
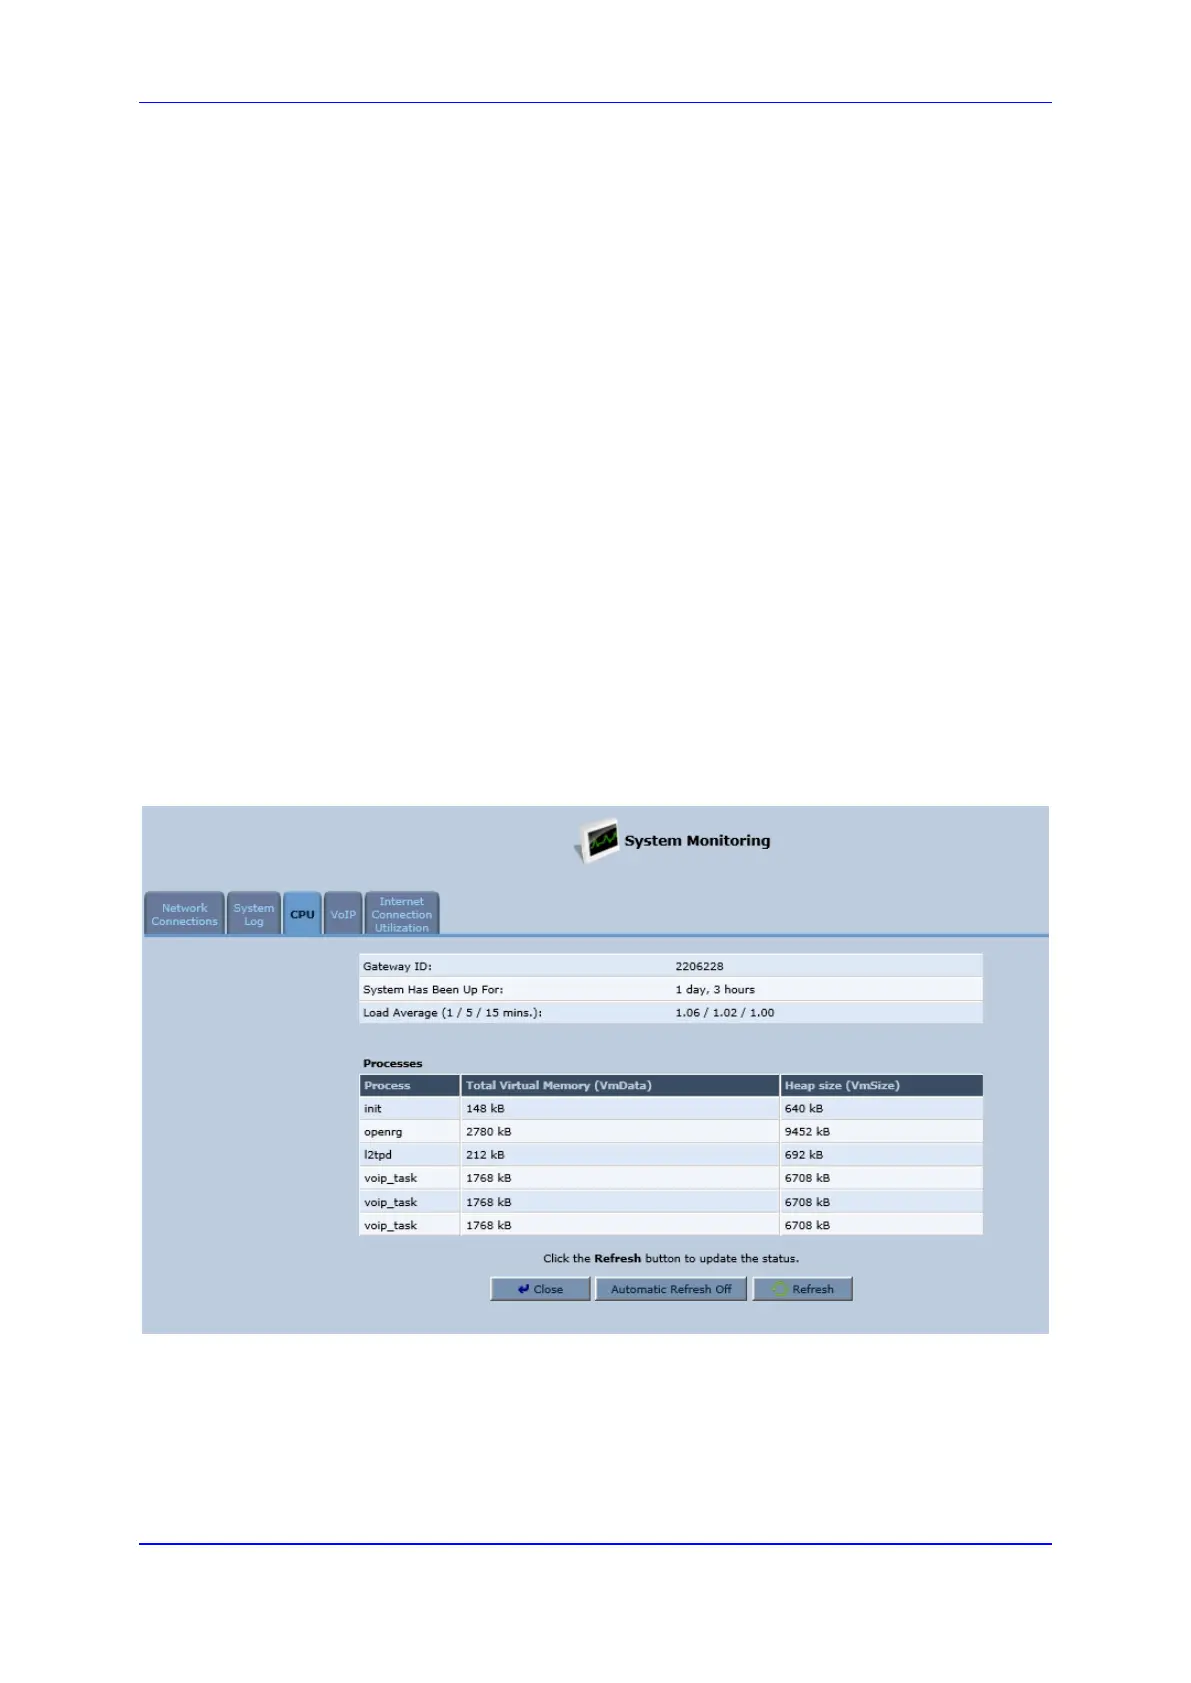
21.3.3 Viewing CPU Statistics
The 'CPU' screen displays the following system parameters:
Gateway ID: Serial number of the device. This number also appears on the printed
label located on the rear panel of the device.
System Has Been Up For: Time that has passed since the device was last started.
Load Average: Average number of processes that are either in a runnable or
uninterruptible state. A process in the runnable state is either using the CPU or waiting
to use the CPU. A process in the uninterruptible state is waiting for I/O access, e.g.
waiting for the disk. The averages are taken over the three time intervals. The
meaning of the load average value varies according to the number of CPUs in the
system. This means for example, that a load average of 1 on a single-CPU system
means that the CPU was loaded all the time, while on a 4-CPU system this means
that the CPU was idle 75% of the time.
Processes: Processes currently running on the device and their virtual memory
usage. The amount of memory granted for each process is displayed as follows:
• Total Virtual Memory (VmData): Amount of memory currently utilized by the
running process.
• Heap size (VmSize): Total amount of memory allocated for the running process.
To view the CPU statistics:
1. From the menu bar, click the System Monitoring menu.
2. Select the CPU tab.
Figure 21-20: CPU Screen
By default, the screen is automatically refreshed. To disable automatic refresh, click
Automatic Refresh Off, and then click the Refresh button each time you want to update
the display.
 Loading...