4 - System setup
135
AgFiniti Mobile
After connecting your HC 8600/9600 display and iPad, you are now ready to start transferring and viewing data.
Once your connection has been established and you have granted access to the display, you should see the display
connection indicator go from red (not connected) to blue (downloading) to green (connected).
You should see an additional icon that indicates your maps are being built from the downloaded data.
This process will occur automatically and nothing has to be done on your part for data to be imported, just keep the app
open while your data processes. And once the process is complete, your data will automatically be mapped.
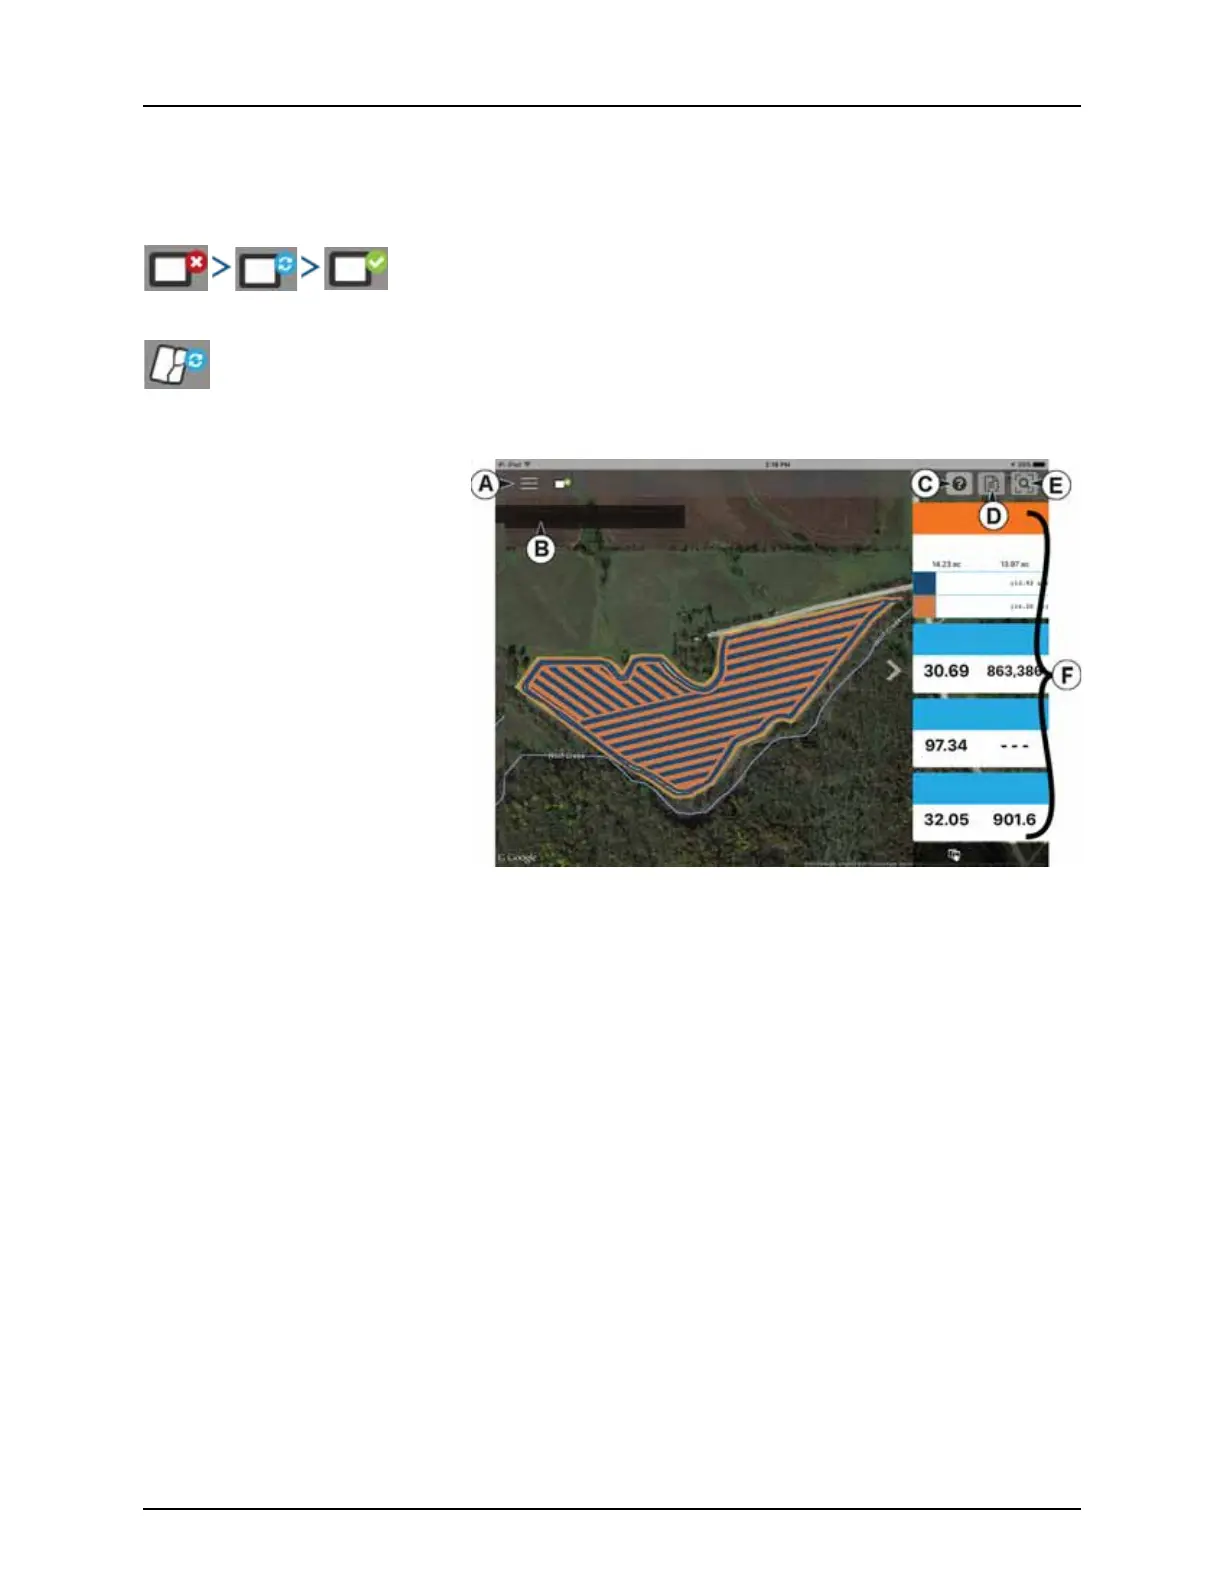
Once data is present, you should see the
layout shown:
A. Menus (“Menu button” on
page 139).
B. Filters (“Filters” on page 136).
C. Help button.
D. Summary Reports (“Summary
Reports” on page 138).
E.
Zoom Options (“Zoom Options” on
page 138).
F. Stat Cards (“Stat Cards” on
page 136).
÷
NOTE! In order to have
background images appear, the
app will need access to an internet
connection.
Creek Bottom All Seasons Planting
Product Name
2016 Planting Corn
Hybrid 2 Hybrid 1
Hybrid 1
Hybrid 2
Rate (Count) (ksds/ac)
2016 Planting Corn
Average
Total
Singulation (%)
2016 Planting Corn
Average Total
Population (Sensed) (ksds/ac)
2016 Planting Corn
Average Total
Selected Stats
 Loading...