115
Storing, Logging and Printing
Viewing the Bar Graph Display
Viewing the Bar Graph Display
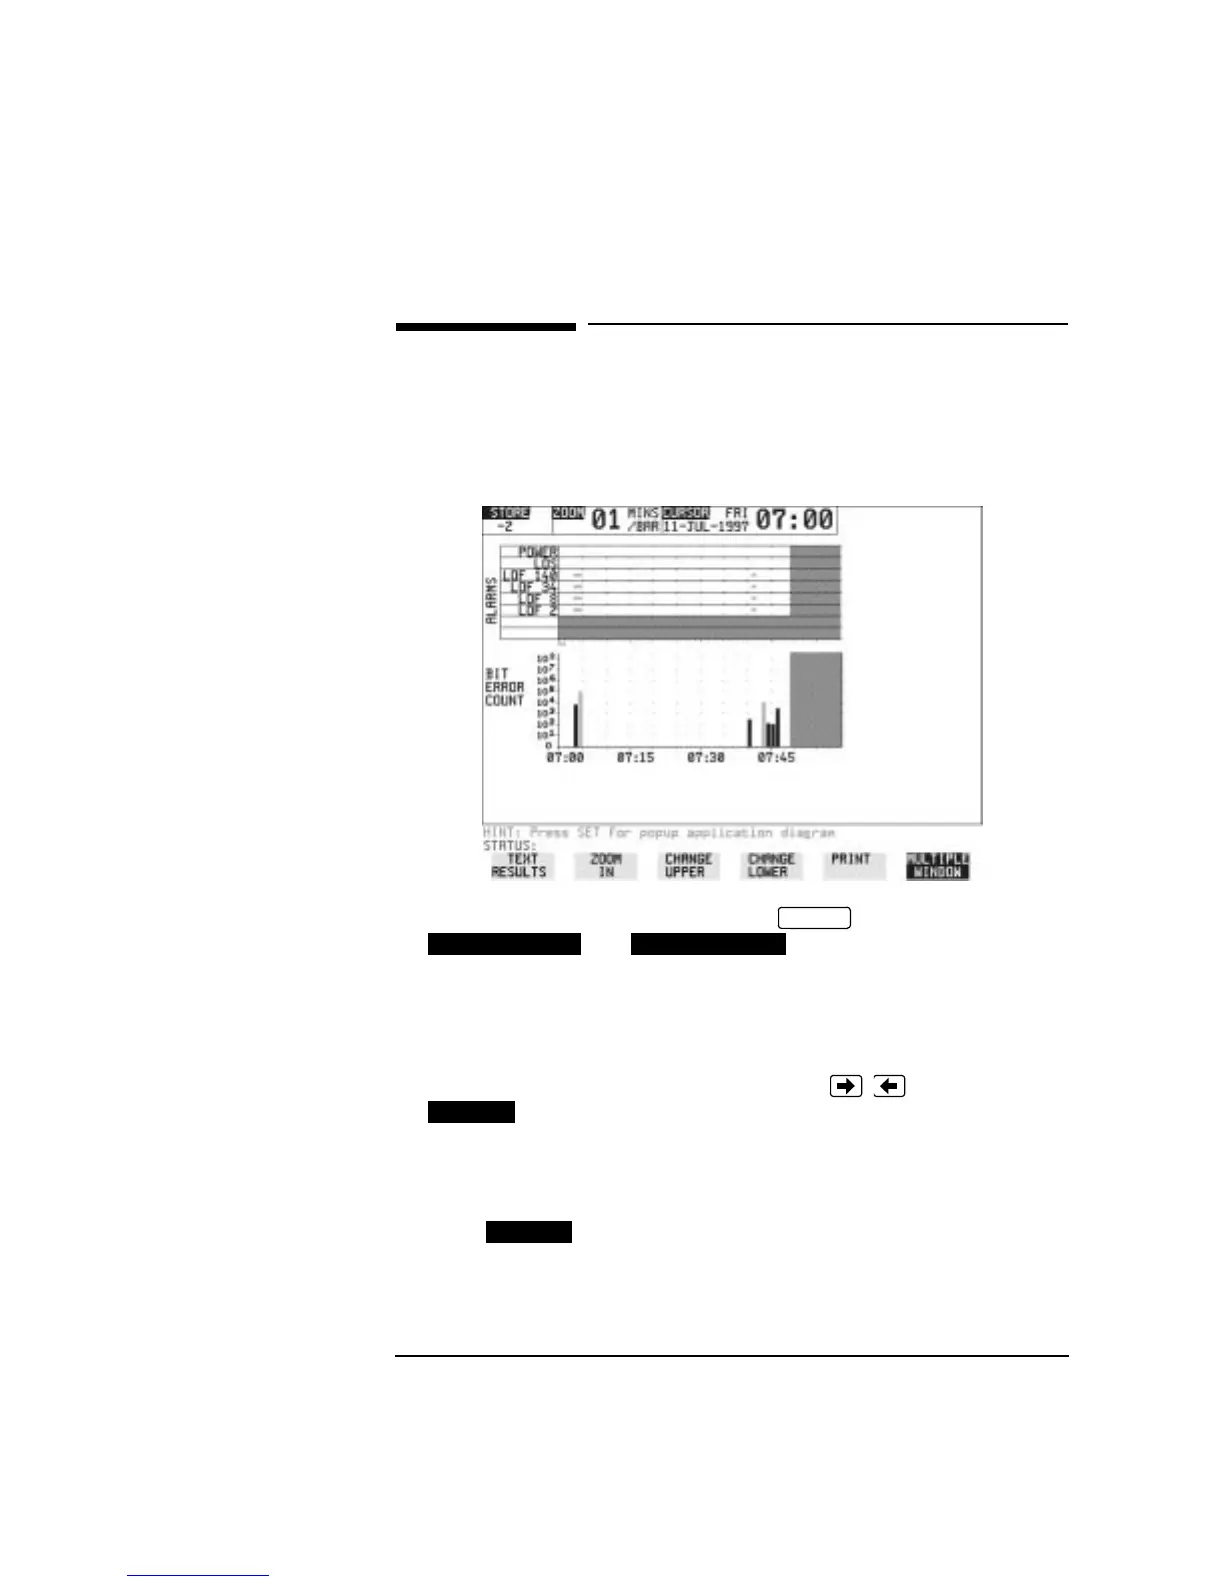
Description All the graphic results obtained during the measurement are available
for viewing. Identify a period of interest and zoom in for more detailed
examination.
HOW TO: 1 To view the current bar graphs, press and use
and to obtain the bar graphs
required.
2 To view previously stored graphs, see "Recalling Stored Graph
Results " page 113.
3 For more detailed inspection of the bar graph, position the cursor
centrally within the area of interest using , and select
to reduce the time axis to 15 MINS/BAR. This is only
possible if the graphics results were stored with a STORAGE
resolution of 1 SEC,1 MINS or 15 MINS.
For further reduction of the time axis to 01 MINS/BAR or 01 SECS/
BAR, position the cursor centrally within the area of interest and
select until the required time axis is obtained.
GRAPH
CHANGE UPPER
CHANGE LOWER
ZOOM IN
ZOOM IN
Artisan Technology Group - Quality Instrumentation ... Guaranteed | (888) 88-SOURCE | www.artisantg.com
 Loading...