T
T
h
h
e
e
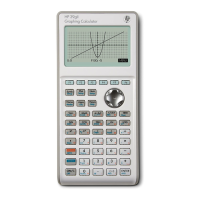
‘
‘
S
S
t
t
a
a
t
t
-
-
T
T
w
w
o
o
’
’
g
g
r
r
o
o
u
u
p
p
o
o
f
f
f
f
u
u
n
n
c
c
t
t
i
i
o
o
n
n
s
s
PREDY(<x-value>)
This function predicts the y value for a pair of columns set up as bivariate data in the Statistics aplet. This is
discussed in more detail in the section covering the Statistics aplet, but a brief summary will be given here.
It assumes that:
(i) the bivariate data is entered into a pair of columns (eg.
C1 and C2, with C1 containing the
independent data and
C2 the dependent data),
and (ii) that these two columns have been specified in the
SYMB view to be paired bivariate data,
and (iii) that this data set has been graphed in the
PLOT view and that the FIT screen key has been
used to plot the line of best fit for the pair of columns,
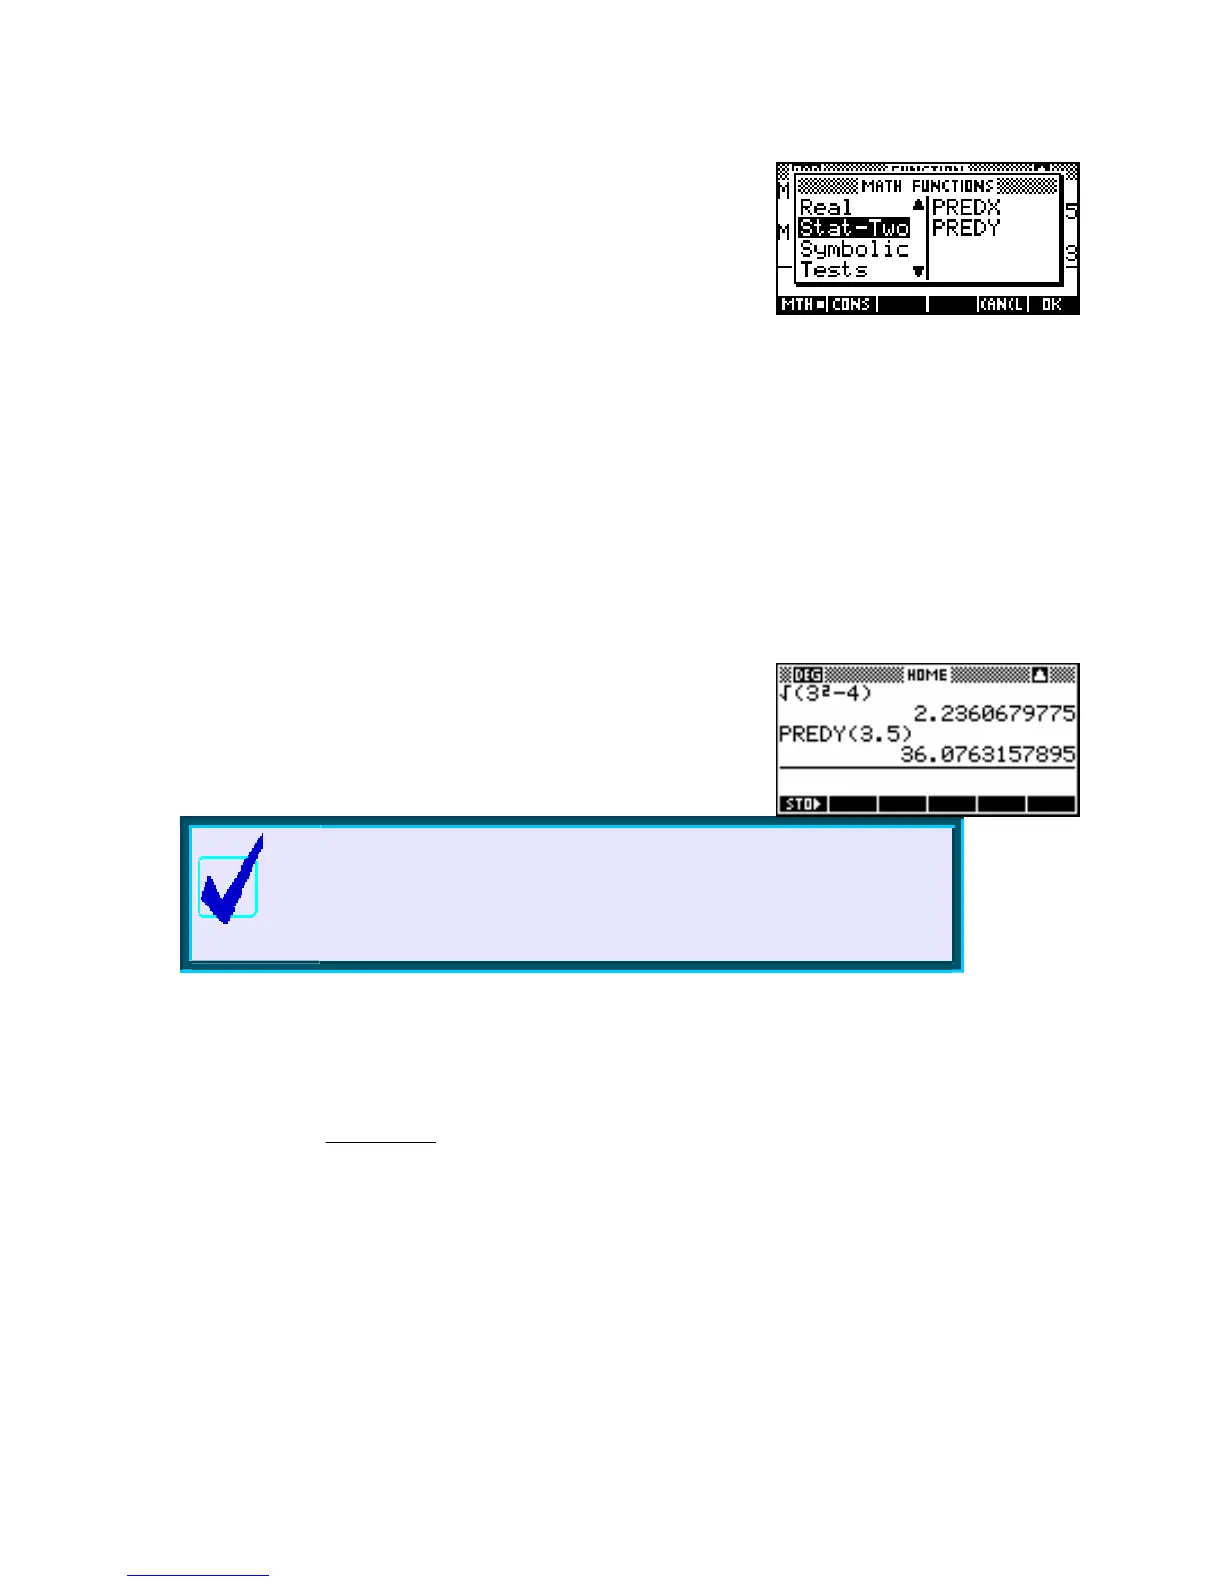
If these conditions are satisfied then the function
PREDY(3.5) will
produce a predicted y (dependent) value for the x (indep.) value of
35
.
Calculator Tip
The line of best fit used in the function PREDY is whichever one was
last plotted. It is up to you to ensure that this is in fact the one you want
used! It is far easier and more reliable to use the facilities provided in
the PLOT view (see page 130) to calculate PREDY values.
PREDX(<y-value>)
0 8199 X +1 1662
The
PREDX function simply reverses the line of best fit. For example, the equation
Y
ˆ
=⋅ ⋅
earlier would use
X
ˆ
=
(Y −1.1662)
to predict the X values.
0.8199
Note:
See page 136 for very important information on this function.
178

 Loading...