9 Visualization
Maschinenfabrik Reinhausen GmbH 2020310 6385142/08 ENETOS
®
ED
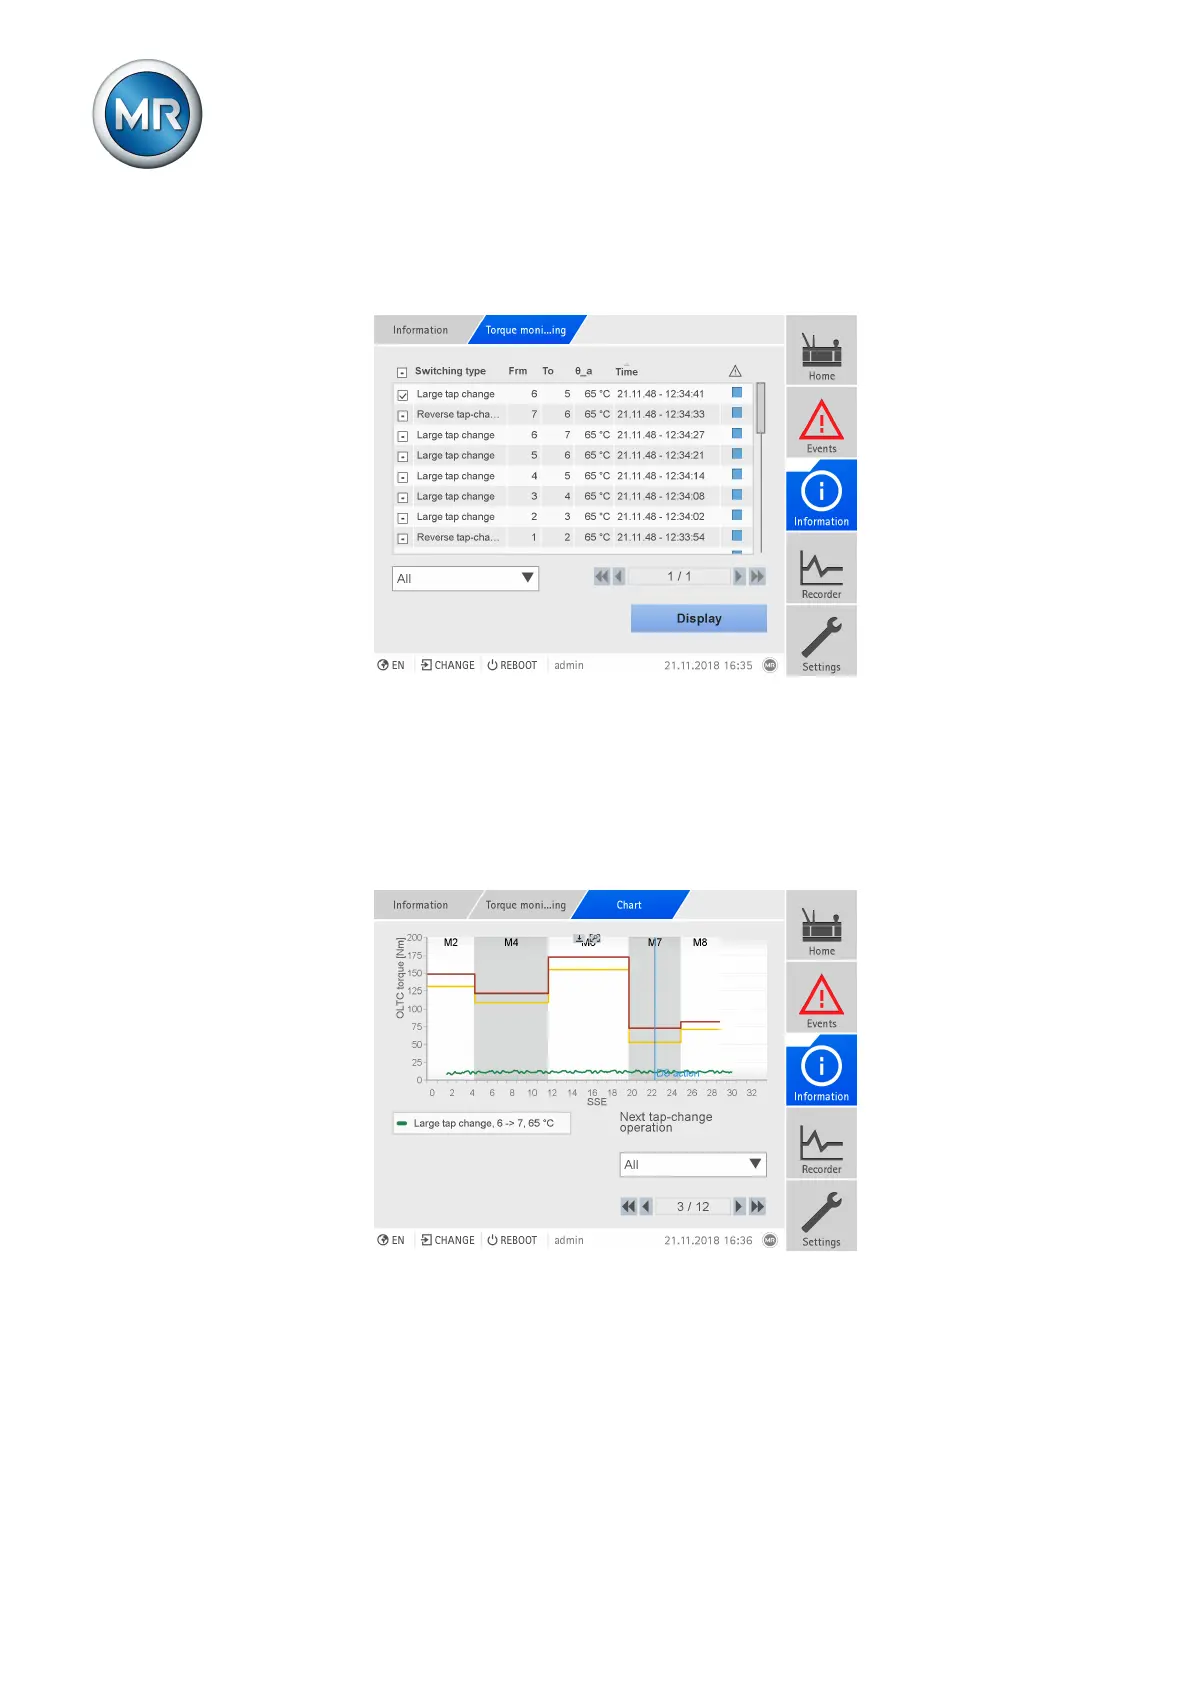
You can use a selection field to filter for the desired tap-change operation
types. You can click the header of the table to sequence the display in as-
cending or descending order according to the desired column.
Figure234: Torque monitoring overview
► Go to Information > On-load tap-changer > Torque monitoring.
Displaying the torque curve
You can display the torque curve for each recorded tap-change operation.
The limit values > and >> are displayed and the time of the diverter switch
action (vertical line) is displayed for each tap-change range (M1...M8).
Figure235: Torque curve
You can select several torque curves to compare (max. 10 torque curves on
the device display; max. 100 torque curves in a web-based visualization on
the PC). If you select several torque curves of various tap-change operation
types, the limit values are not displayed.
 Loading...