1-26
1
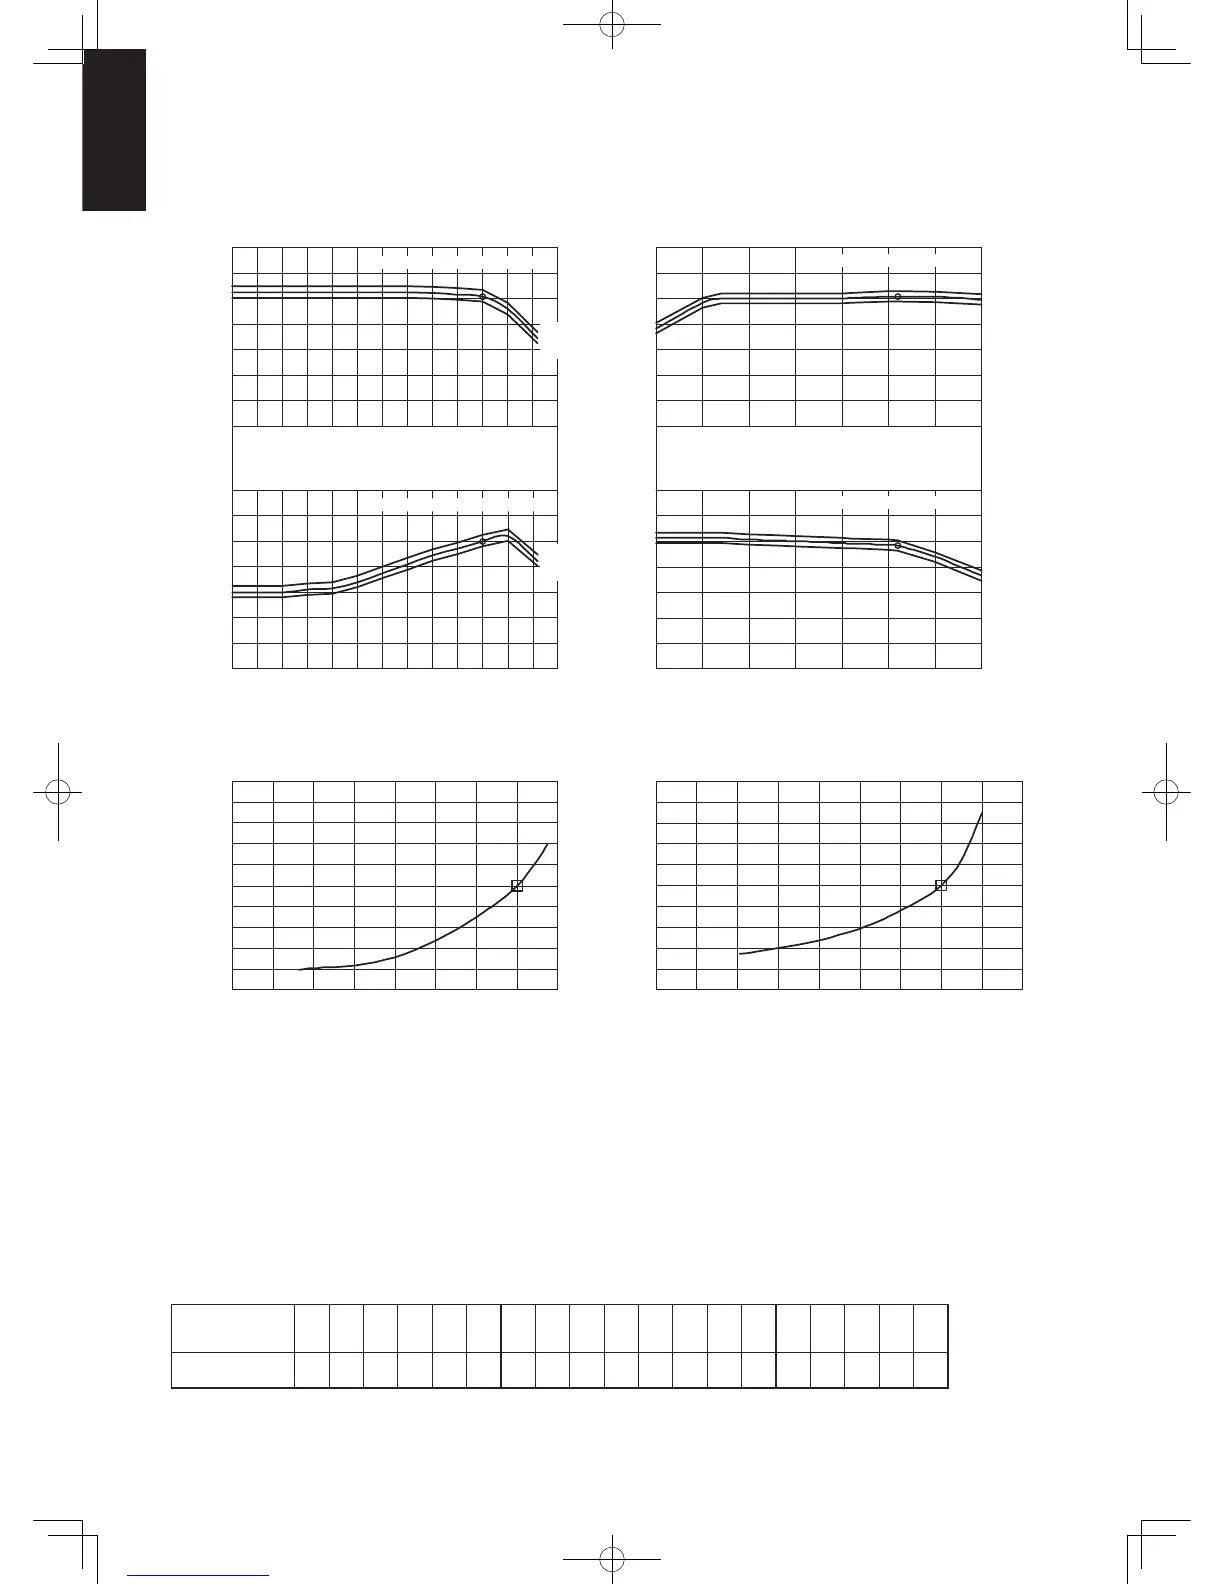
1-5. Capacity Correction Graph According to Temperature Condition
U-140PE1R5 (For 50 Hz)
Cooling capacity ratio (maximum capacity) Heating capacity ratio (maximum capacity)
Input coefficient (%) Capacity coefficient (%)
Outdoor air intake temp ( °C DB)
0
20
40
60
80
100
120
140
0
20
40
60
80
100
120
140
-15
-5 5 15253545
22°CWB
19°CWB
16°CWB
22°CWB
19°CWB
16°CWB
Indoor air intake temp ( °C WB)
Indoor air intake temp ( °C WB)
Input coefficient (%)
0
20
40
60
80
100
120
140
Outdoor air intake temp ( °C WB)
-20 -15 -10 -5 0 5 10 15
Capacity coefficient (%)
0
20
40
60
80
100
120
140
16 °CDB
20 °CDB
24 °CDB
16 °CDB
20 °CDB
24 °CDB
Indoor air intake temp ( °C DB)
Indoor air intake temp ( °C DB)
Cooling
Capacity (kW)
02 46 810121416
Input coefficient (%)
0
20
40
60
80
100
120
140
160
180
200
Capacity (kW)
024681012141618
Heating
Input coefficient (%)
0
20
40
60
80
100
120
140
160
180
200
Outdoor unit heating capacity correction cofficient during of frosting/defrosting (RH approximately 85%)
Outdoor intake air
temperature °C WB
-20 -15 -10 -9 -8 -7 -6 -5 -4 -3 -2 -1 0 1 2 3 4 5 6
Correction coefficient
1.0 1.0 0.97 0.96 0.96 0.95 0.94 0.91 0.89 0.88 0.87 0.87 0.87 0.88 0.89 0.91 0.92 0.95 1.0
To calculate the heating capacity with consideration for frosting/defrosting operation, multiply the heating capacity
found from the capacity graph by the correction coefficient from the table above.
Sec1.indb26Sec1.indb26 2012/03/0717:29:582012/03/0717:29:58
 Loading...