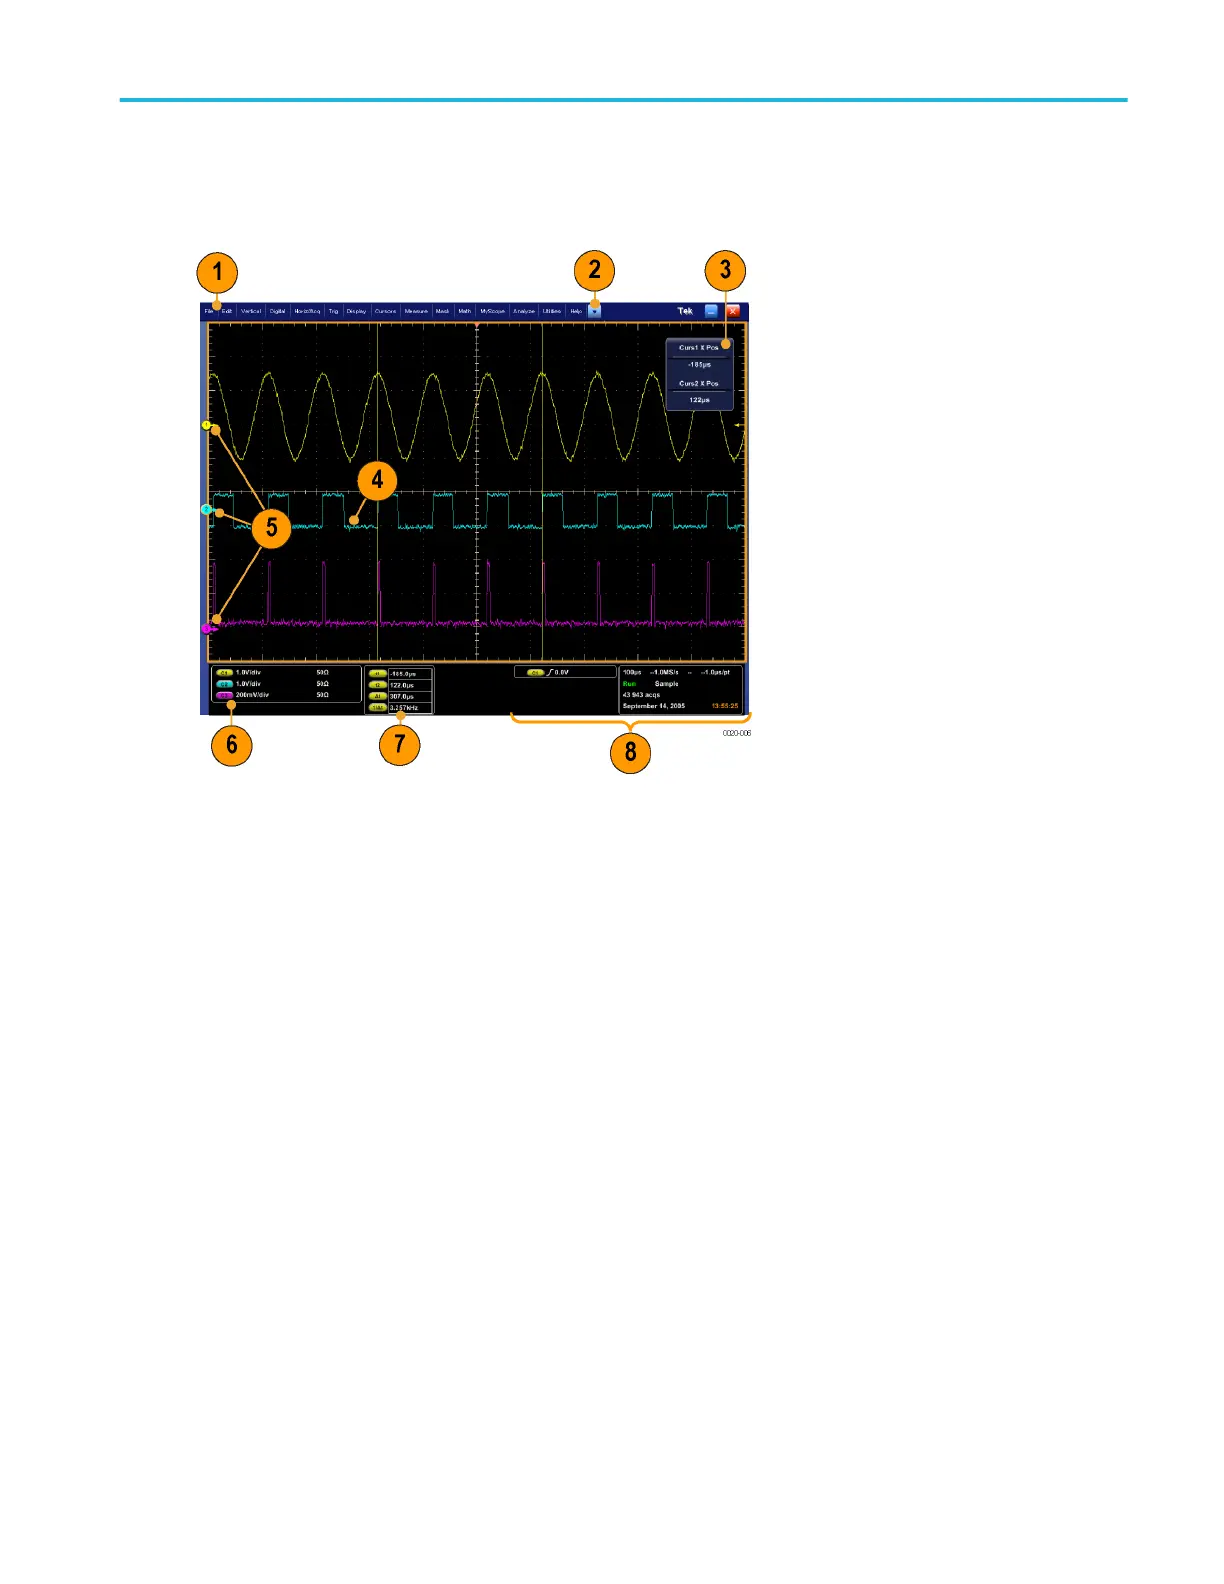
User interface map. See the next figure for a description of the elements of the user interface. These elements provide complete
control of the instrument.
1. Menu bar: Access to data I/O, printing, online help, and instrument functions.
2. Buttons or Menu bar: Click to toggle between toolbar and menu bar modes.
3. Multipurpose knob readouts: Adjust and display parameters controlled by the multipurpose knobs.
4. Display: Waveforms from live, reference, math, and digital channels display here, along with buses and cursors.
5. Waveform handle: Click and drag to change the waveform vertical position.
6. Controls status: Quick reference to vertical selections, scale, and parameters. Probe status is provided for some probe
tips. TekConnect events may include Tip Fault (Line-open, Self-Test Failure of Tip, and Tip broken), Tip Temp Change, Tip
Overheating, and Tip Thermal Shutdown.
7. Readouts: Display of cursor and measurement readouts in this area. You can select measurements from the menu bar or
toolbar.
8. Status: Display of acquisition status, mode, and number of acquisitions; trigger status; date; time; quick reference to
horizontal parameters.
About Tektronix oscilloscopes
DPO70000SX, MSO/DPO70000DX, MSO/DPO70000C, DPO7000C, and MSO/DPO5000B Series 31
 Loading...