<9. Calibration>
9-4
IM 11M12A01-04E 11th Edition : Jul. 19, 2017-00
100
90
80
70
60
50
40
30
20
10
0
0
1 2 3 4 5 6 7 8 9 10 11 12 13
14
15
16
17 18 19
20 21 22
1.0
0.9
0.8
0.7
0.6
0.5
0.4
0.3
0.2
0.1
0.0
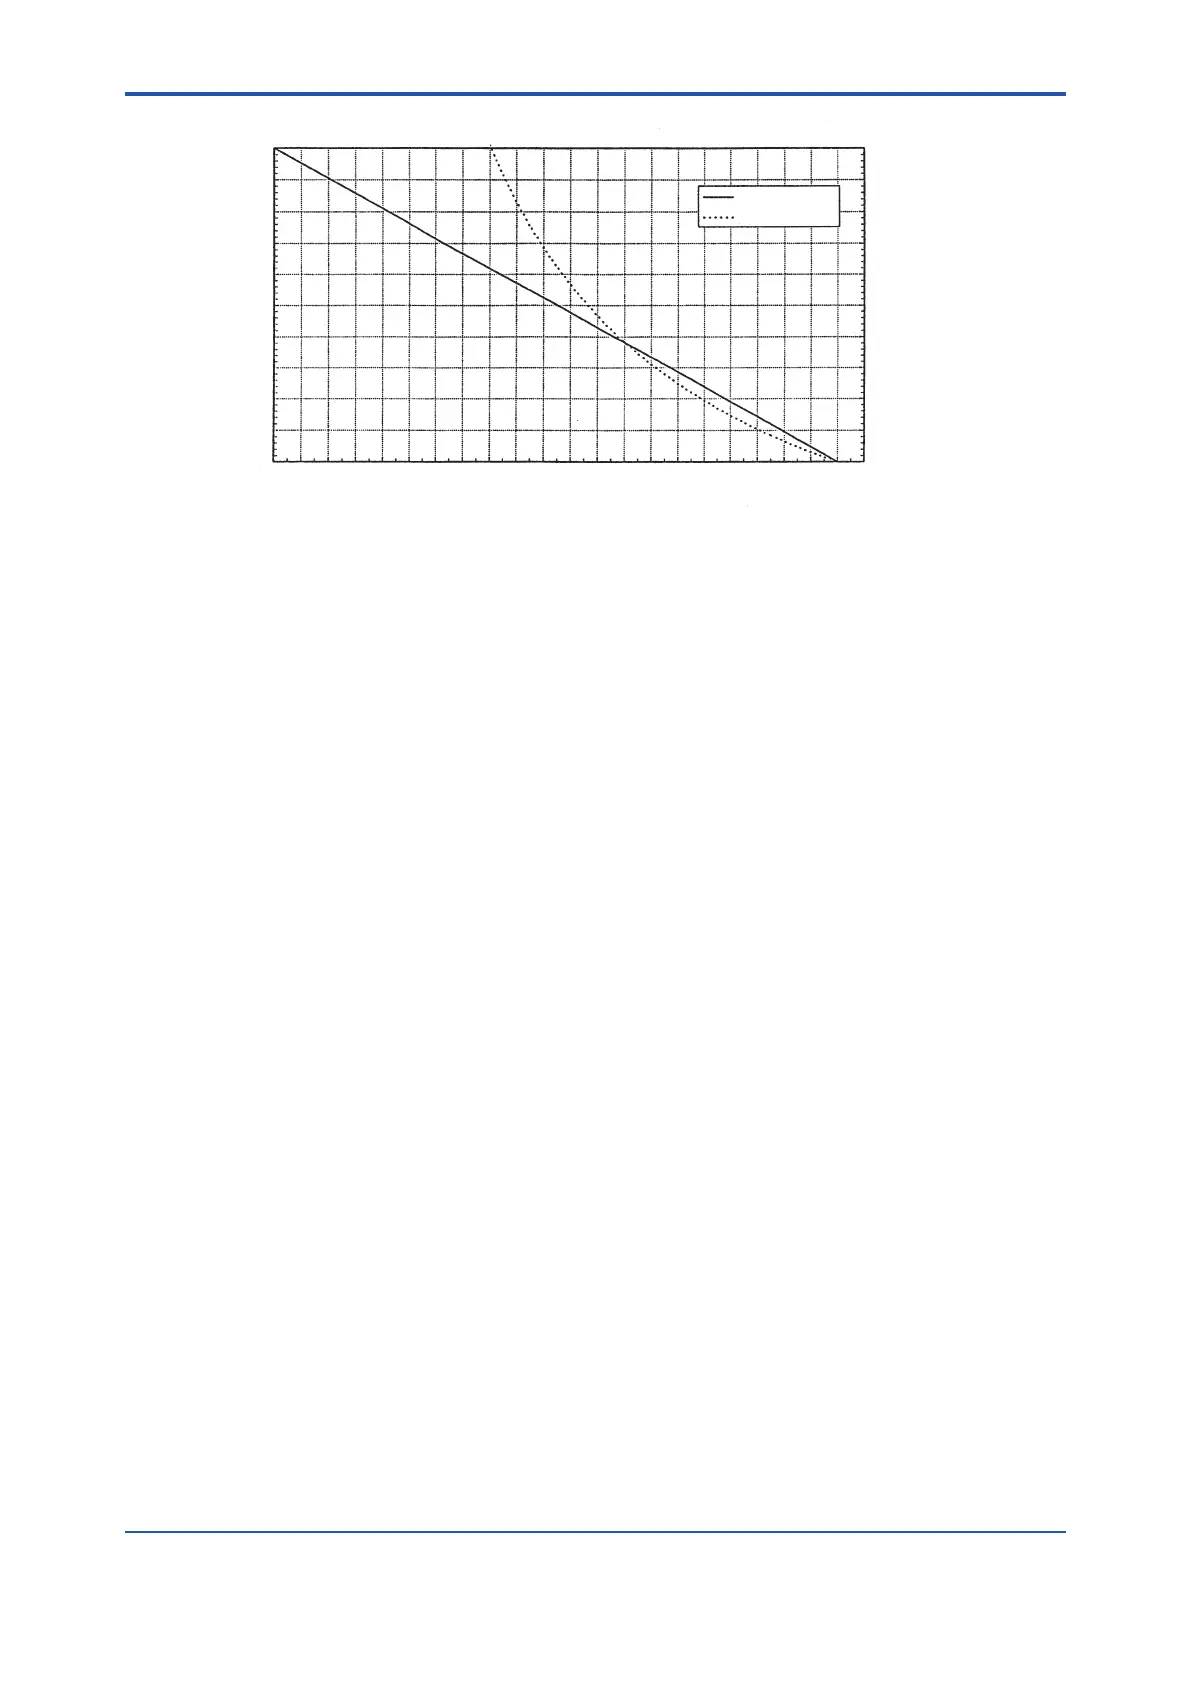
Humidity, vol % H
2
O
Mixing ratio, kg/kg
Humidity, vol % H2O
Oxygen concentration, vol % O
2
Mixing ratio kg/kg
Oxygen concentration vs. Humidity, Mixing ratio
F9-3E.ai
Figure 9.4
9.1.3 Calibration Gas
A gas with a known oxygen concentration is used for calibration. Normal calibration is performed
using two different gases: a zero gas of low oxygen concentration and a span gas of high oxygen
concentration. In some cases, only one of the gases needs to be used for calibration. However,
even if only one of the gases is normally used, calibration using both gases should be done at
least once.
The zero gas normally used has an oxygen concentration of 0.95 to 1.0 vol%O
2
with a balance of
nitrogen gas (N
2
). The span gas widely used is clean air (at a dew-point temperature below -20°C
and free of oily mist or dust, as in instrument air).
9.1.4 Compensation
The deviation of a measured value from the theoretical cell electromotive force is checked by the
method in Figure 9.5 or 9.6.
Figure 9.5 shows a two-point calibration using two gases: zero and span. Cell electromotive
forces for a span gas with an oxygen concentration p1 and a zero gas with an oxygen
concentration p2 are measured while determining the calibration curve passing between these
two points. The oxygen concentration of the sample gas is determined from this calibration
curve. In addition, the calibration curve corrected by calibration is compared with the theoretical
calibration curve for determining the zero correction ratio represented by B/A x 100 (%) on the
basis of A, B and C shown in Figure 9.5 and a span correction ratio of C/A x 100 (%). If the zero
correction ratio exceeds the range of 100 ± 30% or the span correction ratio becomes larger than
0 ± 18%, calibration of the sensor becomes impossible.
 Loading...