<10. Other Functions>
10-5
IM 11M12A01-04E 11th Edition : Jul. 19, 2017-00
mA
90%
100%
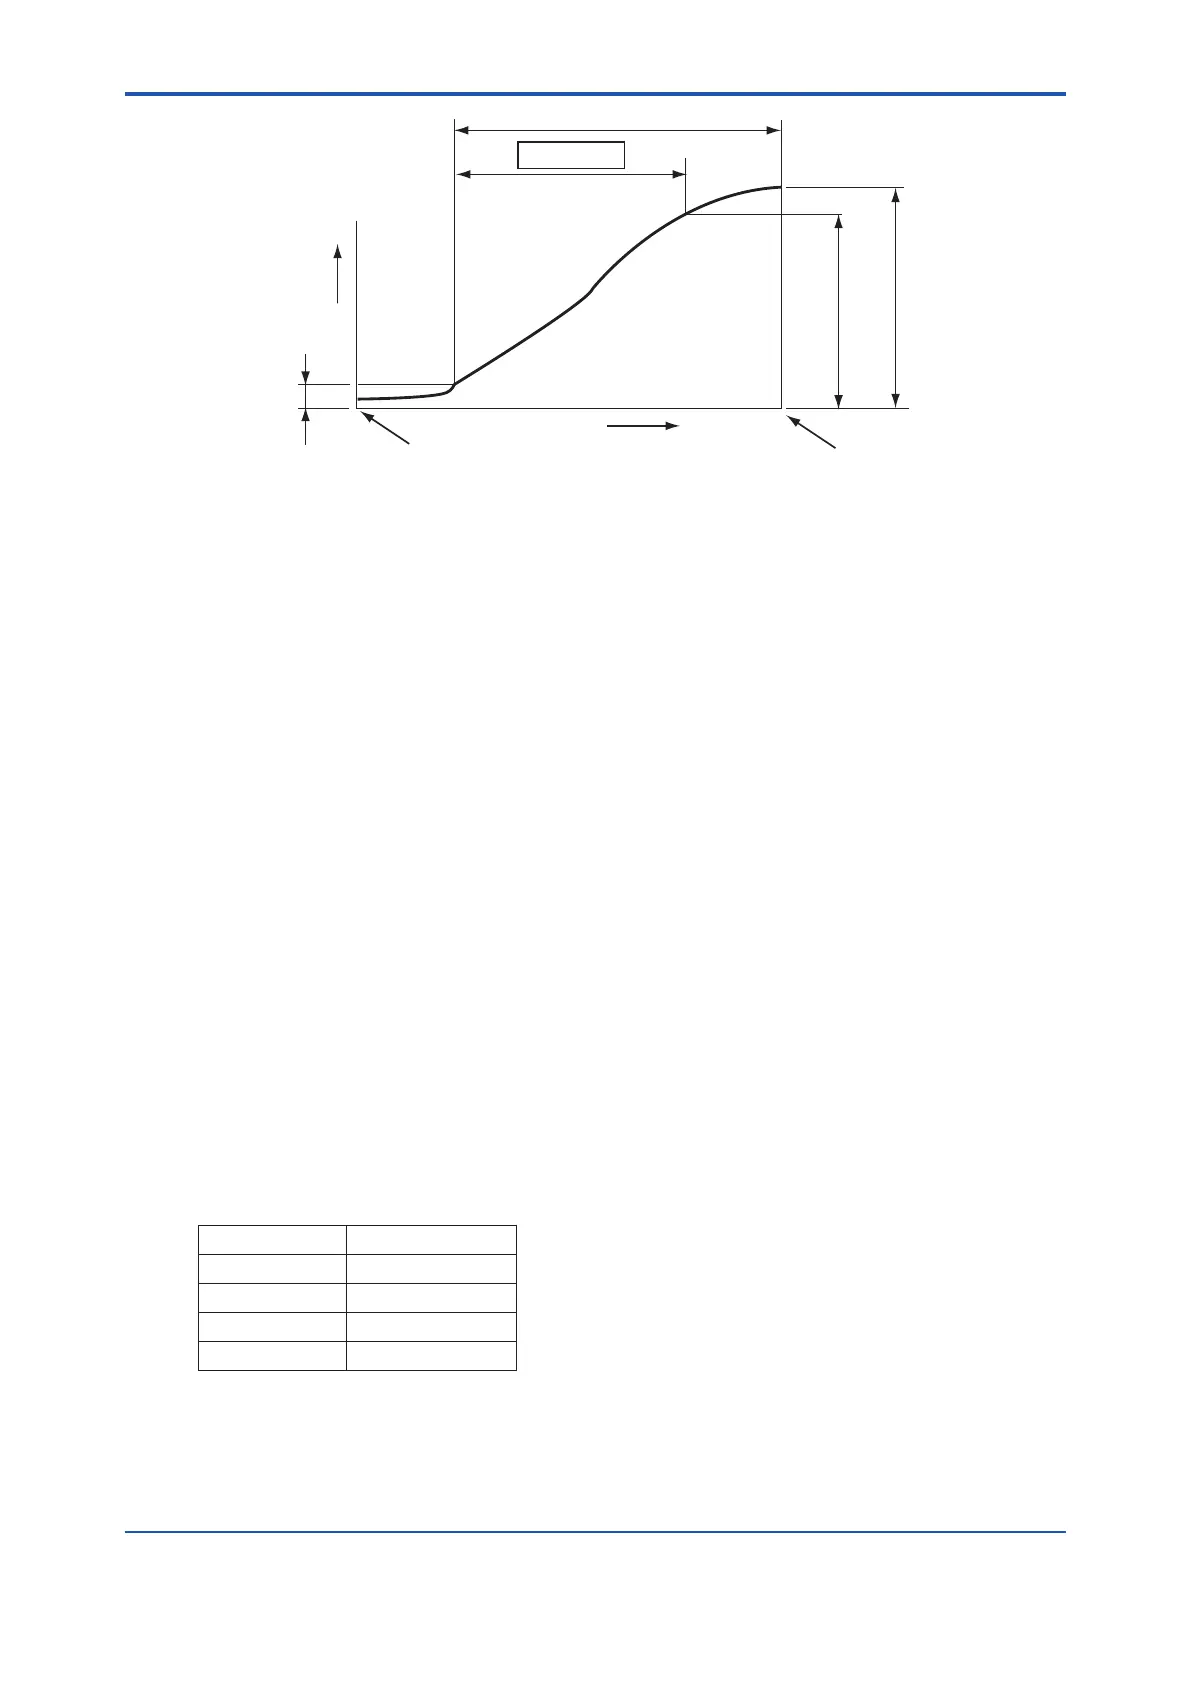
The response time is obtained after the corrected calibration curve has been found. The response time
is calculated, starting at the point corresponding to 10% of the analog output up to the point at 90% of
the analog output span. That is, this response time is a 10 to 90% response.
10% of analog
output span
Five minutes maximum
Response time
Start calibration
Time
complete
Figure 10.1 Typical Response Time characteristics
10.1.16 Cell’s Internal Resistance
A new cell (sensor) indicates its internal resistance of 200 Ω maximum. As the cell degrades, so
will the cell’s internal resistance increase. The degradation of the cell cannot be found only by
changes in cell’s internal resistance, however. Those changes in the cell’s internal resistance will
be a hint to knowing the sensor is degrading. The updated values obtained during the calibration
are displayed.
10.1.17 Robustness of a Cell
The robustness of a cell is an index for predicting the remaining life of a sensor and is expressed
as one of four time periods during which the cell may still be used:
(1) more than a year
(2) more than six months
(3) more than three months
(4) less than one month
The above four time periods are tentative and only used for preventive maintenance, not for
warranty of the performance.
This cell’s robustness can be found by a total evaluation of data involving the response time, the
cell’s internal resistance, and calibration factor. However, if a zero or span calibration was not
made, the response time cannot be measured. In such a case, the response time is not used as
a factor in evaluating the cell’s robustness.
Table 10.3 Cell Robustness and Service Life
Cell robustness Cell s service life
5 One year min.
3 Six months min.
2 Three months min.
1 One month max.
10.1.18 Heater On-Time Ratio
The probe sensor is heated to and maintained at 750°C. When the sample gas temperature is
high, the amount of heater ON-time decreases.
 Loading...