QX5
QXFXO4/QXISDN4/QXE1T1/QXFXS24; (SW Version 6.0.x) 103
QXFXO4/QXISDN4/QXE1T1/QXFXS24 Manual II: Administrator’s Guide
System Status
General Information
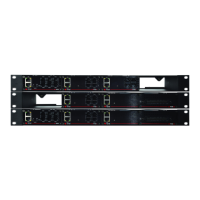
The General Information page includes the following information:
• Uptime duration -
Period QX is running since last reboot.
• Device hostname - QX device host name.
• Application Software - Software and file system versions
of the QX.
• Language Pack – this field is present only when the
custom language pack is uploaded and it indicates the
version.
Fig.II- 158: System Status - General Information page
Network Status
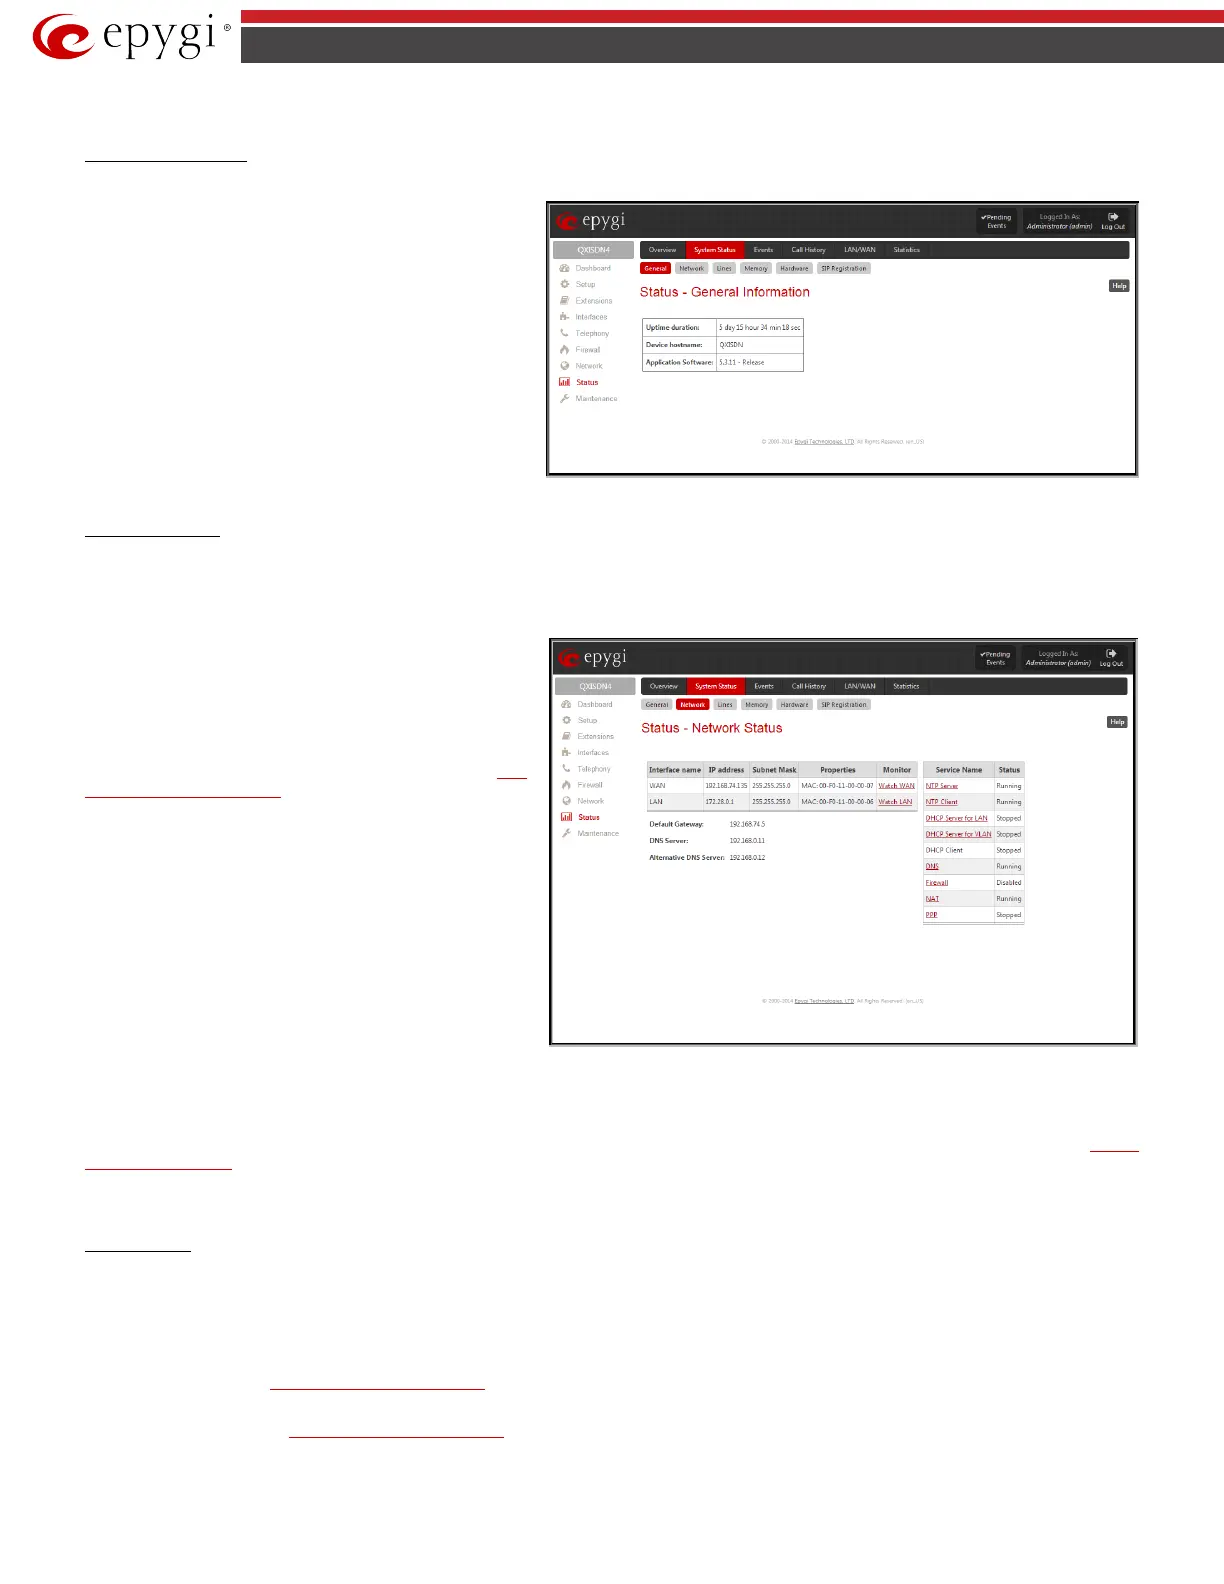
The Network Status page includes the following information about Interfaces:
Interface Name lists the Network interfaces available on the QX (LAN, WAN and a number of PPPs, depending on the number of active PPP connections).
IP Address lists the IP addresses corresponding to each network interface.
Subnet Mask
lists the subnet masks corresponding to each
network interface.
Properties will list either the MAC address corresponding to
each network interface on the QX.
Monitor includes links to survey LAN, WAN and PPP traffic
correspondingly. The selection of these links will open the
LAN
and WAN Interface Statistics page with a table of network traffic
statistics on the following selected interfaces:
Fig.II- 159: System Status - Network Status page
•
• Received Packets
• Received Errors
• Received Drop Errors
• Received Overrun Errors
• Received MultiCast Packets
•
• Transmitted Packets
• Transmitted Errors
• Transmitted Drop Errors
• Transmitted Carrier Errors
• Transmitted Collisions
When opening the corresponding interface statistics window, no traffic values are displayed at first. After opening the window, the tables will serve as a
counter and traffic statistics will be updated every minute.
DNS Server, Alternative DNS Server and Default Gateway - these display the QX settings corresponding to what has been configured with the
System
Configuration Wizard.
Services (NTP Server and Client, DHCP Server and Client, DNS, Firewall, NAT, PPP ) statuses: shows if they have stopped or if they are still running.
Lines Status
The table Status - Lines Status shows the current status of each FXS, FXO line, ISDN or E1T1 trunk (depending on QX gateway model) with all details of
active call. Since only one line information is displayed at a time, the FXS, FXO line, ISDN or E1T1 trunk functional buttons are used to navigate through the
other lines’/trunks’ information. It shows only the information for one of the line/trunk at a time. To navigate through the other lines'/trunks’ information
select the link with the appropriate line number on the top of the page.
The FXO Channel Usage Statistics link (available for QXFXO4 gateways only) is only present for local FXO lines (this option is not available for shared
FXO lines) and leads to the Statistics - PSTN Channel Usage page where diagram chart of FXO lines usage can be viewed.
The ISDN Channel Usage Statistics link (available for QXISDN4 gateways only) is only present for local ISDN lines (this option is not available for shared
ISDN trunks) and leads to the
Statistics - PSTN Channel Usage page where diagram chart of ISDN trunks usage can be viewed.
 Loading...