11-2 Dash™ 3000/4000/5000 2000966-386D
Monitoring SpO2
Introduction
Overview
Non-invasive SpO
2
monitoring measures the amount of oxygenated hemoglobin and
pulse rate by measuring the absorption of selected wavelengths of light. The light
generated in the sensor passes through the tissue and is converted into an electrical
signal by photodetectors in the sensor.
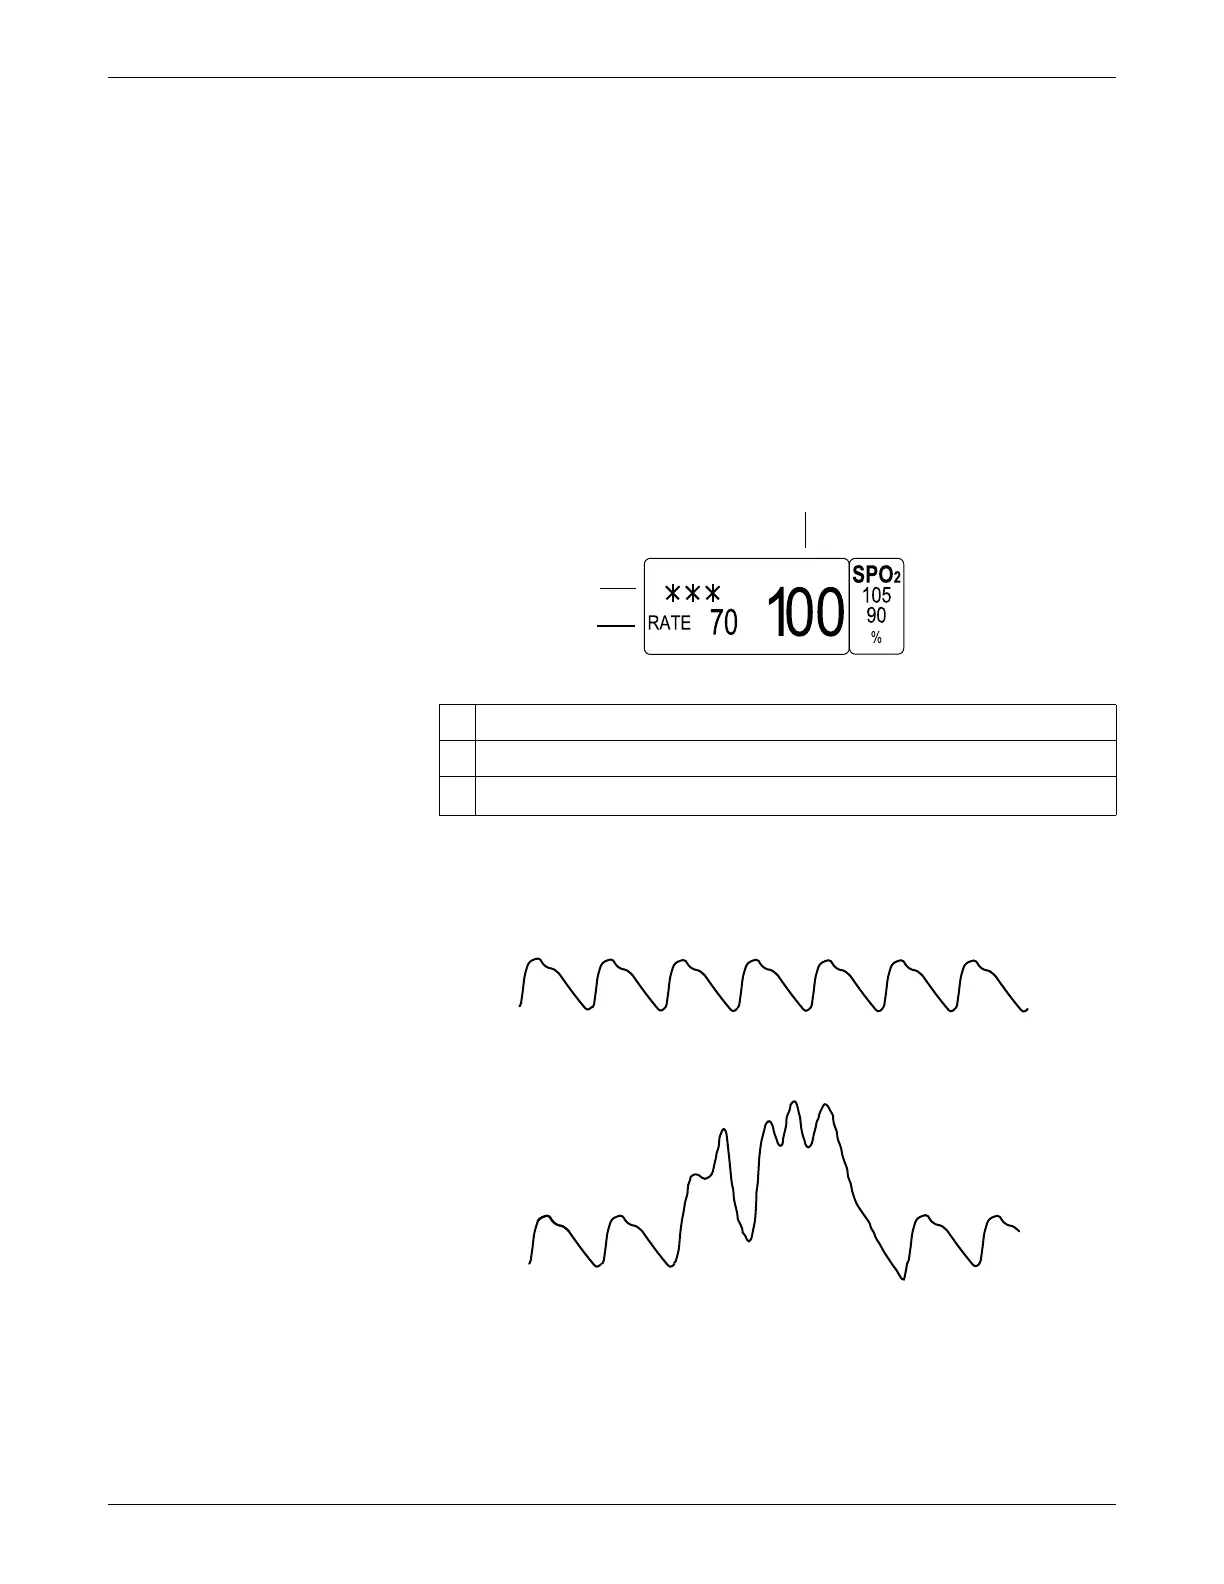
The monitor processes the electrical signal and displays digital values for SpO
2
and
pulse rate. A parameter window displays when a patient cable is connected to the
monitor. The display updates every two seconds.
719A
An SpO
2
waveform is also displayed. The following examples show a good quality
and bad quality waveform. Bad quality waveforms display motion artifact. The
motion at the sensor site is indicated by noise spikes in the normal waveform.
687A
Good quality waveform
031A
Bad quality waveform
1 Signal strength indicator
2 Derived pulse rate value
3 SpO
2
value
 Loading...