6-4 Dash™ 3000/4000/5000 2000966-386D
Patient Data
607C
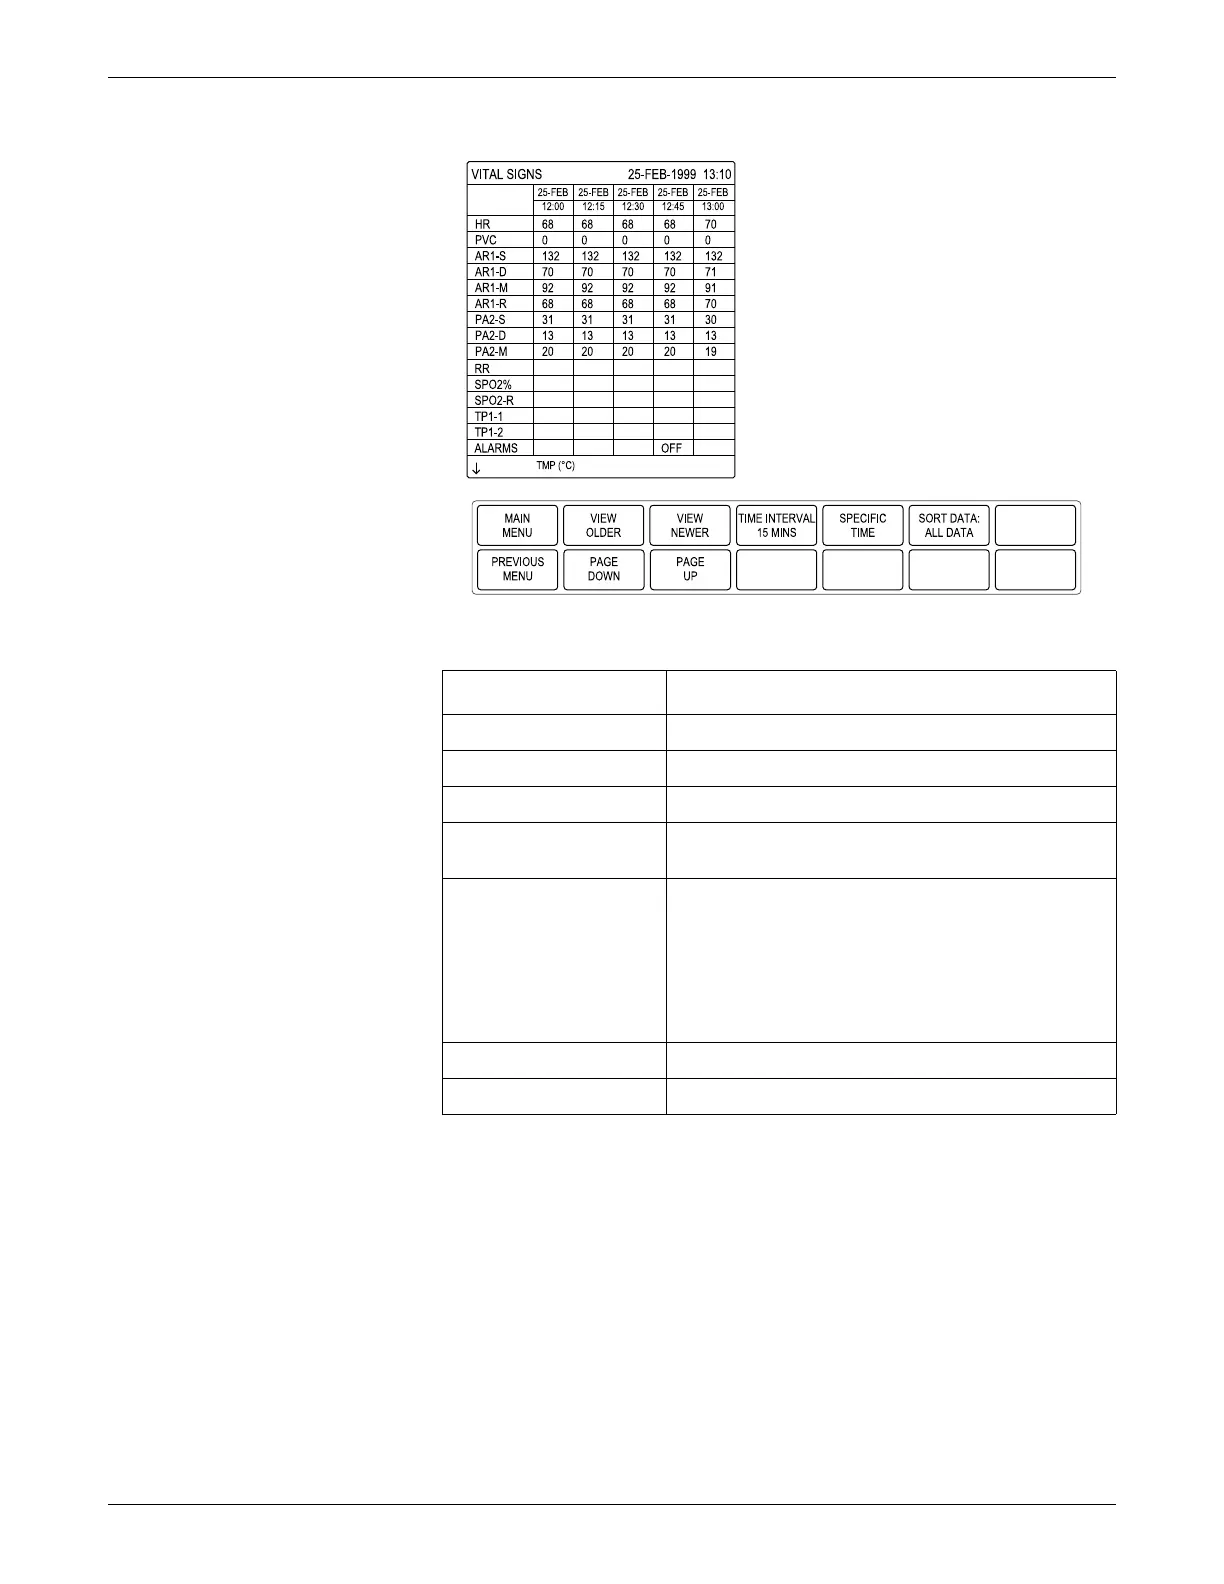
Use the following options to review VITAL SIGNS.
Graphic Trends
GRAPHIC TRENDS allows you to create a graphic representation of a parameter
over a specified period of time. It uses median values from the collected patient data
to create a one minute resolution trends.
Episodic parameters are stored every time an event occurs. Non-episodic parameters
are sampled 30 times a minute.
To display GRAPHIC TRENDS, select MORE MENUS > PATIENT DATA >
GRAPHIC TRENDS.
Option Function
VIEW OLDER View the previous event.
VIEW NEWER View the next event.
TIME INTERVAL Select the desired time interval for the patient data display.
SPECIFIC TIME Select a specific time period of collected patient data to
display in the information window.
SORT DATA Select one of the following episodic parameters to sort the
collected patient data. The data prints in the same order
displayed.
NBP
Cardiac calculations
Pulmonary calculations
PAGE DOWN View the next page.
PAGE UP View the previous page.
 Loading...