Monitor the System
252
NETGEAR 24-Port Gigabit Smart Managed Pro Switch with PoE+ and 2 SFP Ports Model GS724TPv2
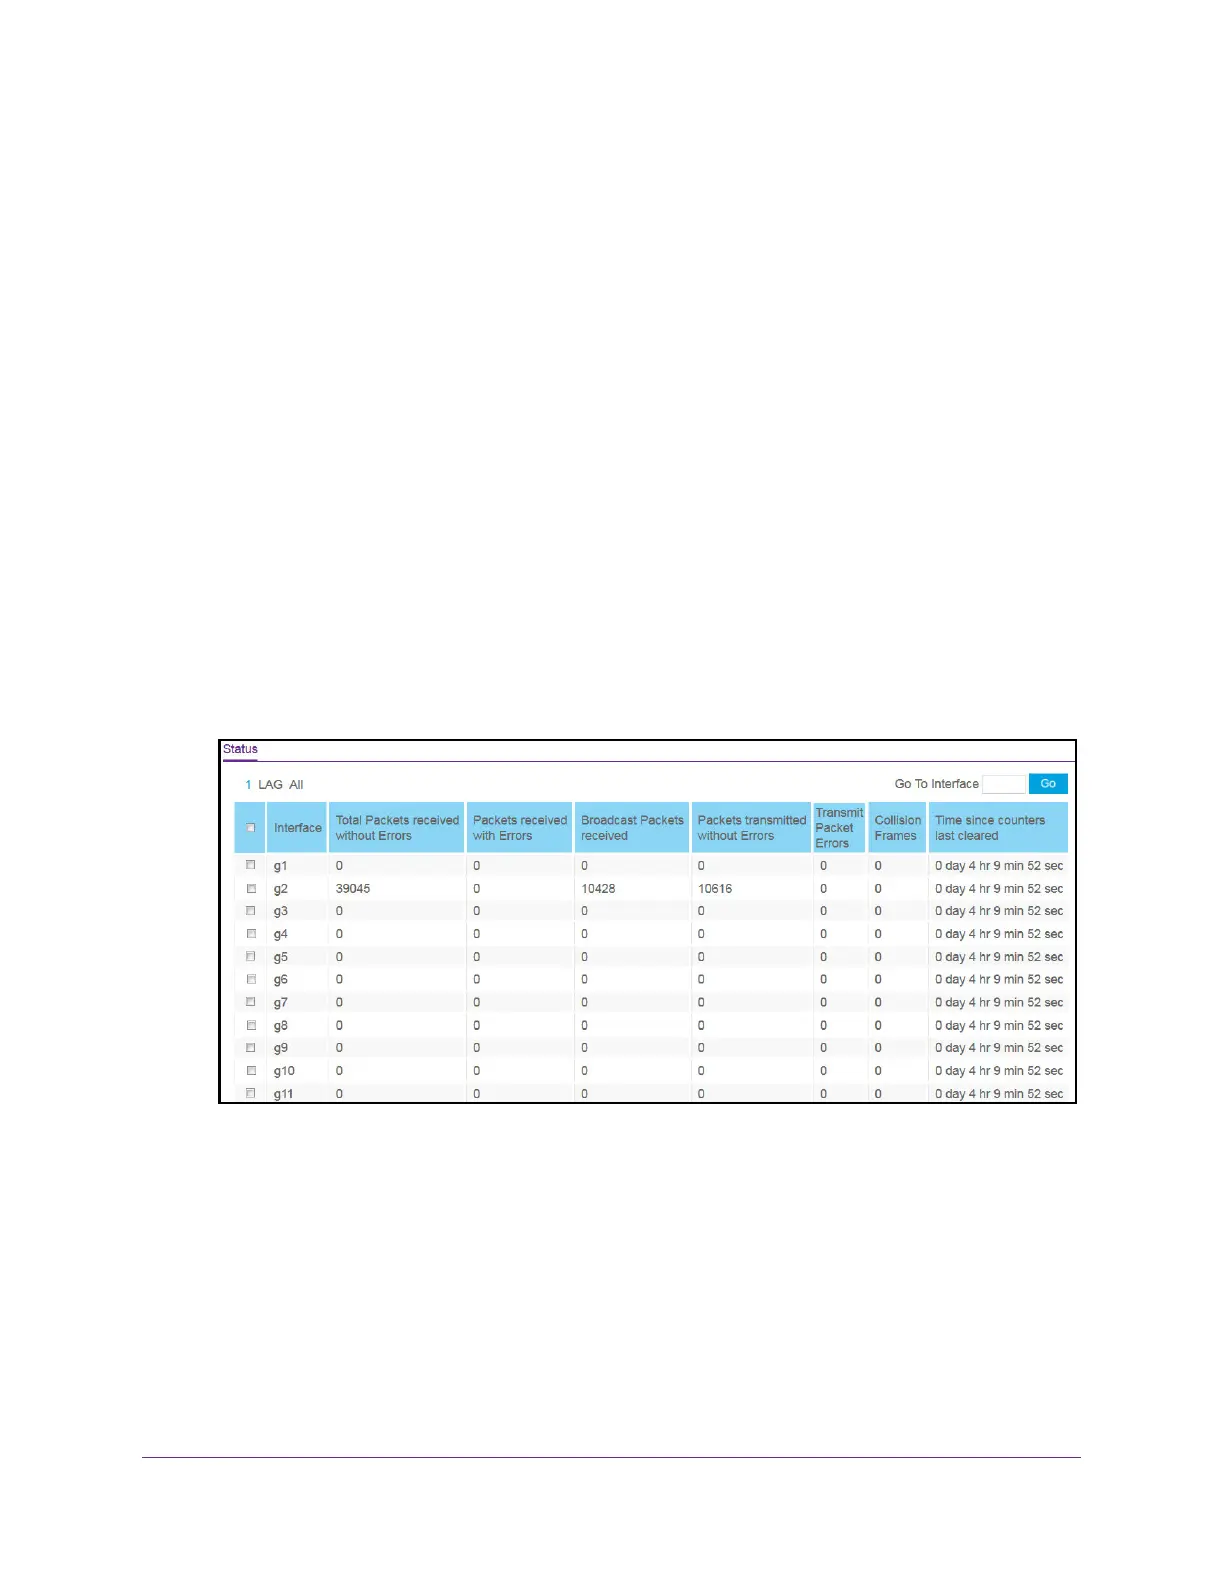
View Port Statistics
You can display a summary of per-port traffic statistics on the switch.
To view port statistics:
1. Connect your computer to the same network as the switch.
You can use a WiFi or wired connection to connect your computer to the network, or
connect directly to a switch that is off-network using an Ethernet cable.
2. Launch a web browser.
3. In the address field of your web browser, enter the IP address of the switch.
If you do not know the IP address of the switch, see Change the Default IP Address of the
Switch on page 9.
The login window opens.
4. Enter the switch’s password in the Password field.
The default password is password.
The System Information page displays.
5. Select Monitoring > Ports > Port Statistics.
6. Select whether to display physical interfaces, link aggregation groups (LAGs), or both by
clicking one of the following links above the table heading:
• 1 (or the unit ID of the switch). Only physical interfaces are displayed. This is the
default setting.
• LAG. Only link aggregation groups are displayed.
• All. Both physical interfaces and link aggregation groups are displayed.
To locate an interface quickly, type the interface number using the respective naming
convention (for example, g1 or l1) in the Go To Interface field above or below the table and
click the Go button. See Interface Naming Conventions on page 21 for more information.
The entry corresponding to the specified interface is selected.
 Loading...