EasyManuals Logo
Home>Feasa>Measuring Instruments>ICT Series

Feasa ICT Series User Manual

Default Icon
145 pages
To Next Page IconTo Next Page
To Previous Page IconTo Previous Page
Page #139 background imageLoading...
Page #139 background image
FEASA LED ANALYSER
ICT VERSION
PWM LED Mode
Effect of PWM on Intensity Testing
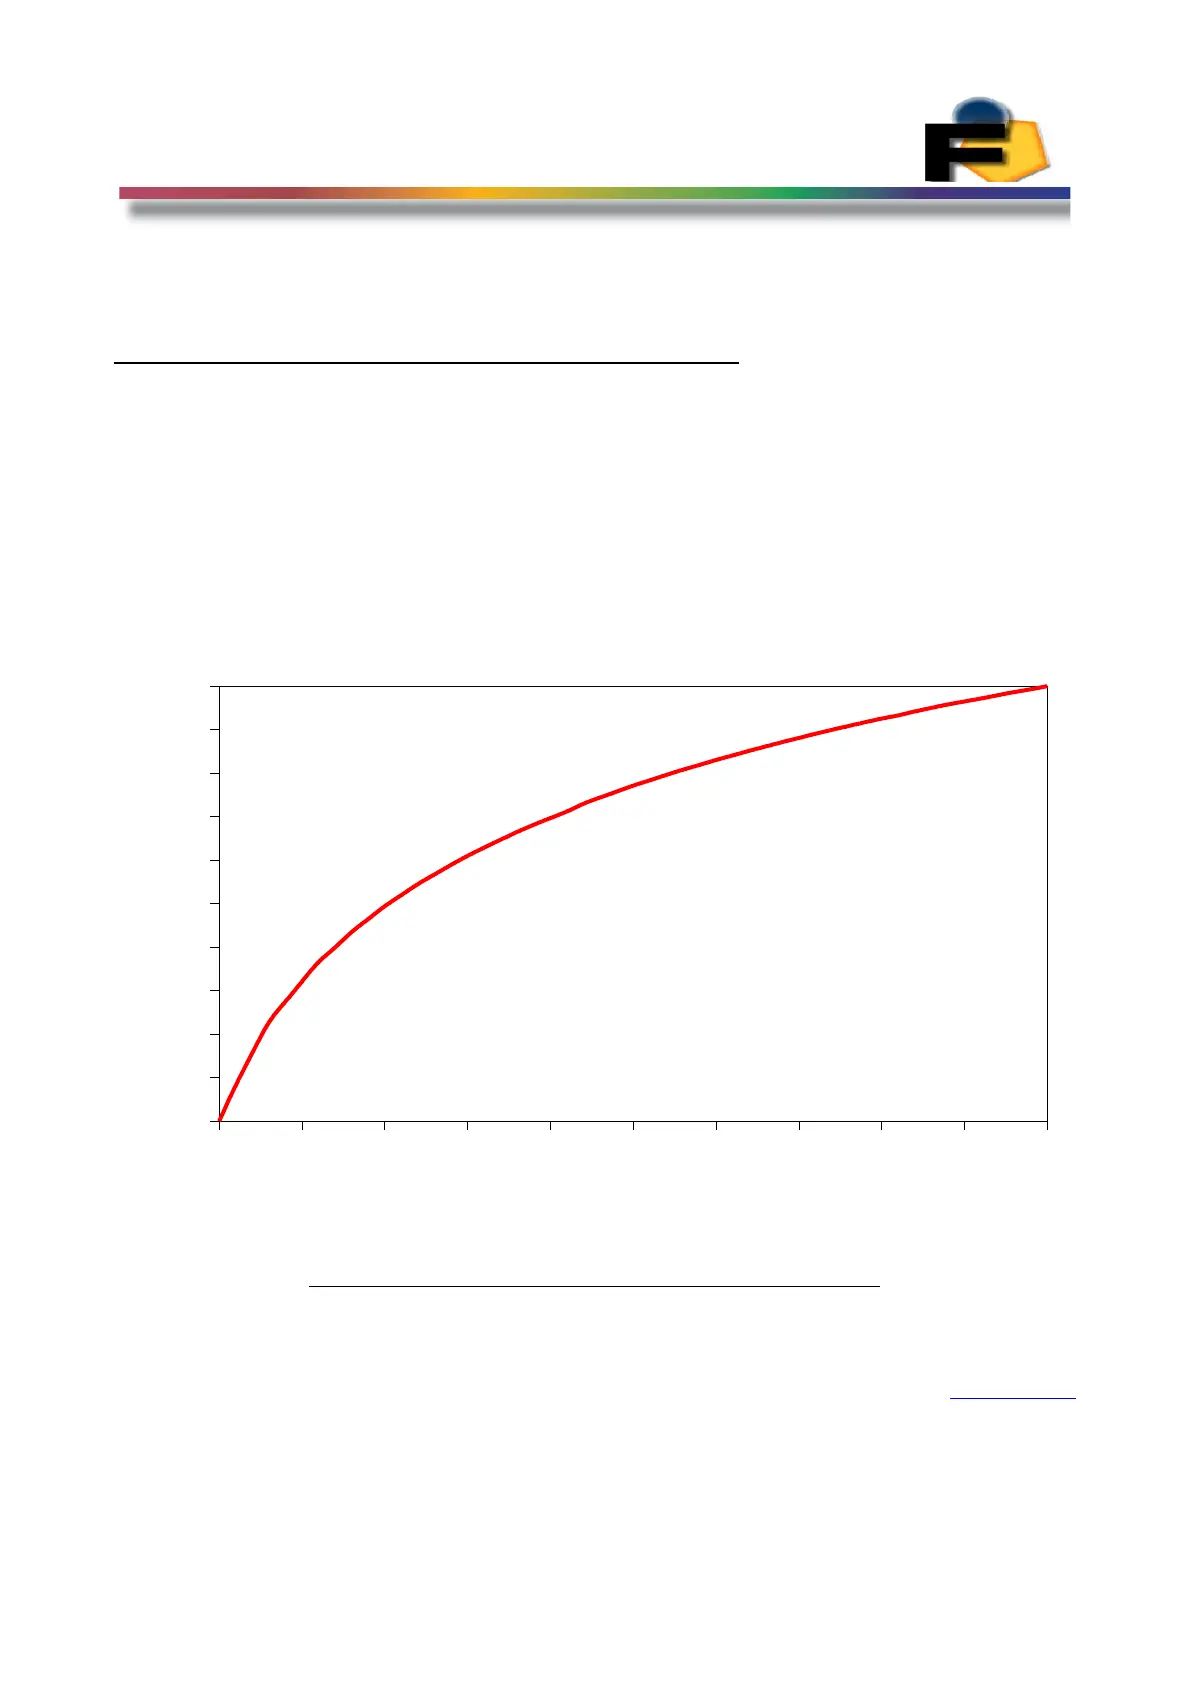
The effect of Pulse Width Modulation (PWM) of a typical LED on the Analyser Intensity can be
seen in Figure 29. In this graph the LED will always be on at 100% modulation. The Intensity
has been normalised to 100% at 100% modulation. When the modulation has been reduced to
50% (i.e. the LED is off 50% of the time) the relative Intensity drops to approximately 80%.
At 20% modulation ( the LED is off 80% to the time) the relative Intensity drops to
approximately 50%.
0 10 20 30 40 50 60 70 80 90 100
0
0.1
0.2
0.3
0.4
0.5
0.6
0.7
0.8
0.9
1
Re lative Logarithm ic Intens ity vs Duty Cycle in PWM Capture
Du ty Cycle (%)
Relative I n ten sity
Figure 29: Normalized Intensity versus Modulation
Back to Index
139

Table of Contents

Questions and Answers:

Question and Answer IconNeed help?

Do you have a question about the Feasa ICT Series and is the answer not in the manual?

Feasa ICT Series Specifications

General IconGeneral
BrandFeasa
ModelICT Series
CategoryMeasuring Instruments
LanguageEnglish

Related product manuals