August 2003
5-4 Displaying and Configuring Data
The View Option
The second option, View, allows you to select the presentation of
a parameter in one of three formats: numeric, bar graph or line
graph
1. From the Display Menu, press the [X] key once to reach the
View option, and then press
[ENTER].
2. A drop-down menu shows the three formats. Scroll to the
appropriate selection.
3. Press
[ENTER] to confirm your selection.
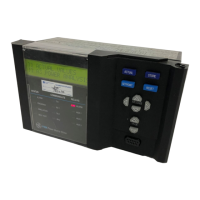
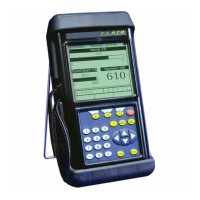
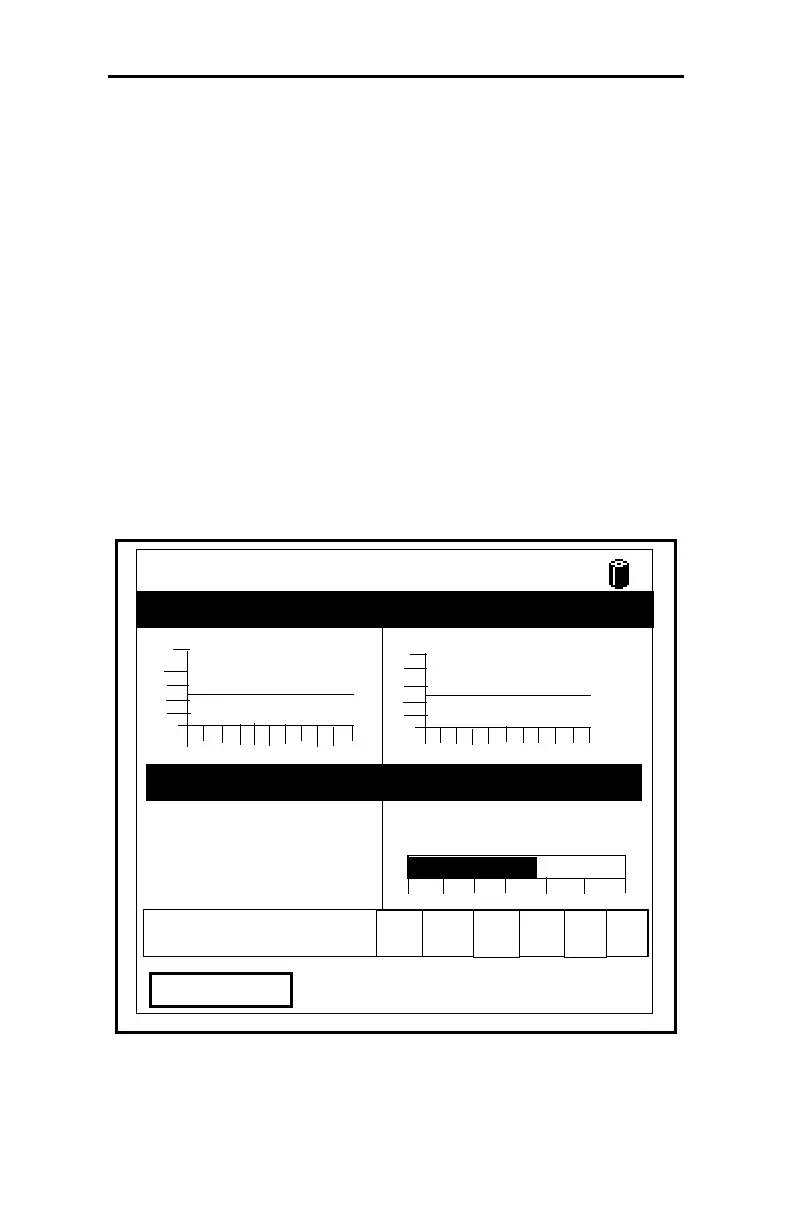
The screen immediately displays any changes. For example, if
you have changed the first parameter to a line graph, the screen
appears similar to Figure 5-3 below.
Figure 5-3: Screen After Format Change
2002/11/30 09:53 AM
Dew Point, °C
Temperature, °C
23.0
Pressure, PSIg
55.00
10.0
Run Time, Hours
ABC
K
10 Minutes
-30
70
0
612
-52.0
-150
50
15 Minutes
About
 Loading...

