Displaying and Configuring Data 5-5
August 2003
The Limits Option
Once you have configured a parameter as a line or bar graph, you
might need to change its presentation or values. The Limits
option (replacing the Format option for line and bar graphs)
enables you to program the minimum or maximum values
displayed, the time interval and the display of the average value.
To enter the Limits option:
1. Press
[SEL] from the Operate Mode window until you have
reached the desired measurement.
2. Press
[ENTER] to open the Display Menu.
3. Be sure the Limits option is highlighted, and press
[ENTER].
The screen appears similar to Figure 5-4 below.
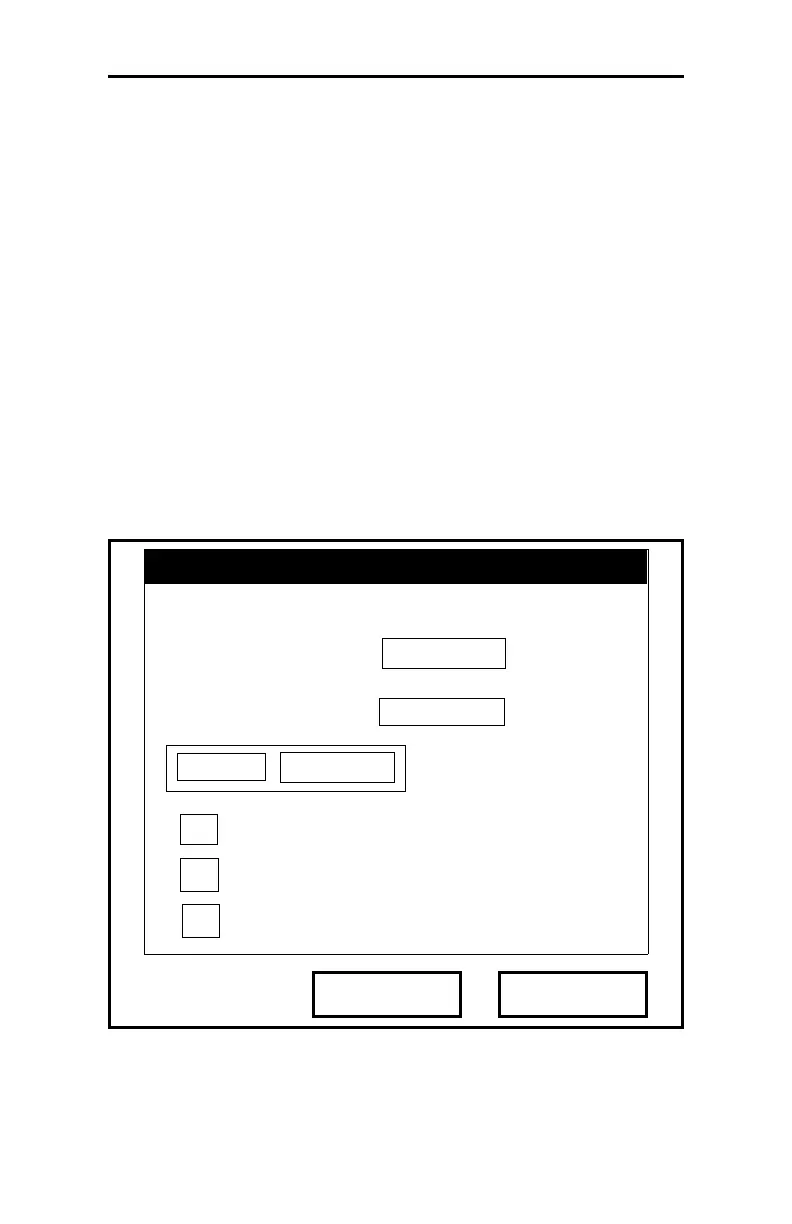
Figure 5-4: The Line (or Bar) Graph Parameters
Window
Programming
Set Line Graph Parameters
Cancell
OK
Dew Point
Use Lines
Plot Average Value
10
Seconds
-12.2
Minimum
Maximum
12.2
Show Minimum and Maximum
 Loading...