Buffer 8-3
Buffer statistics
• MIN and MAX provides the minimum and maximum readings stored in the buffer. It
also indicates the buffer location of these readings.
• The PK-PK (peak-to-peak) value is the difference between the maximum and mini-
mum readings stored in the buffer:
PK-PK = MAX - MIN
• Average is the mean of the buffer readings. Mean is calculated as follows:
Where: X
i
is a stored reading
n is the number of stored readings
• The STD DEV value is the standard deviation of the buffered readings. Standard devi-
ation is calculated as follows:
Where: X
i
is a stored reading
n is the number of stored readings
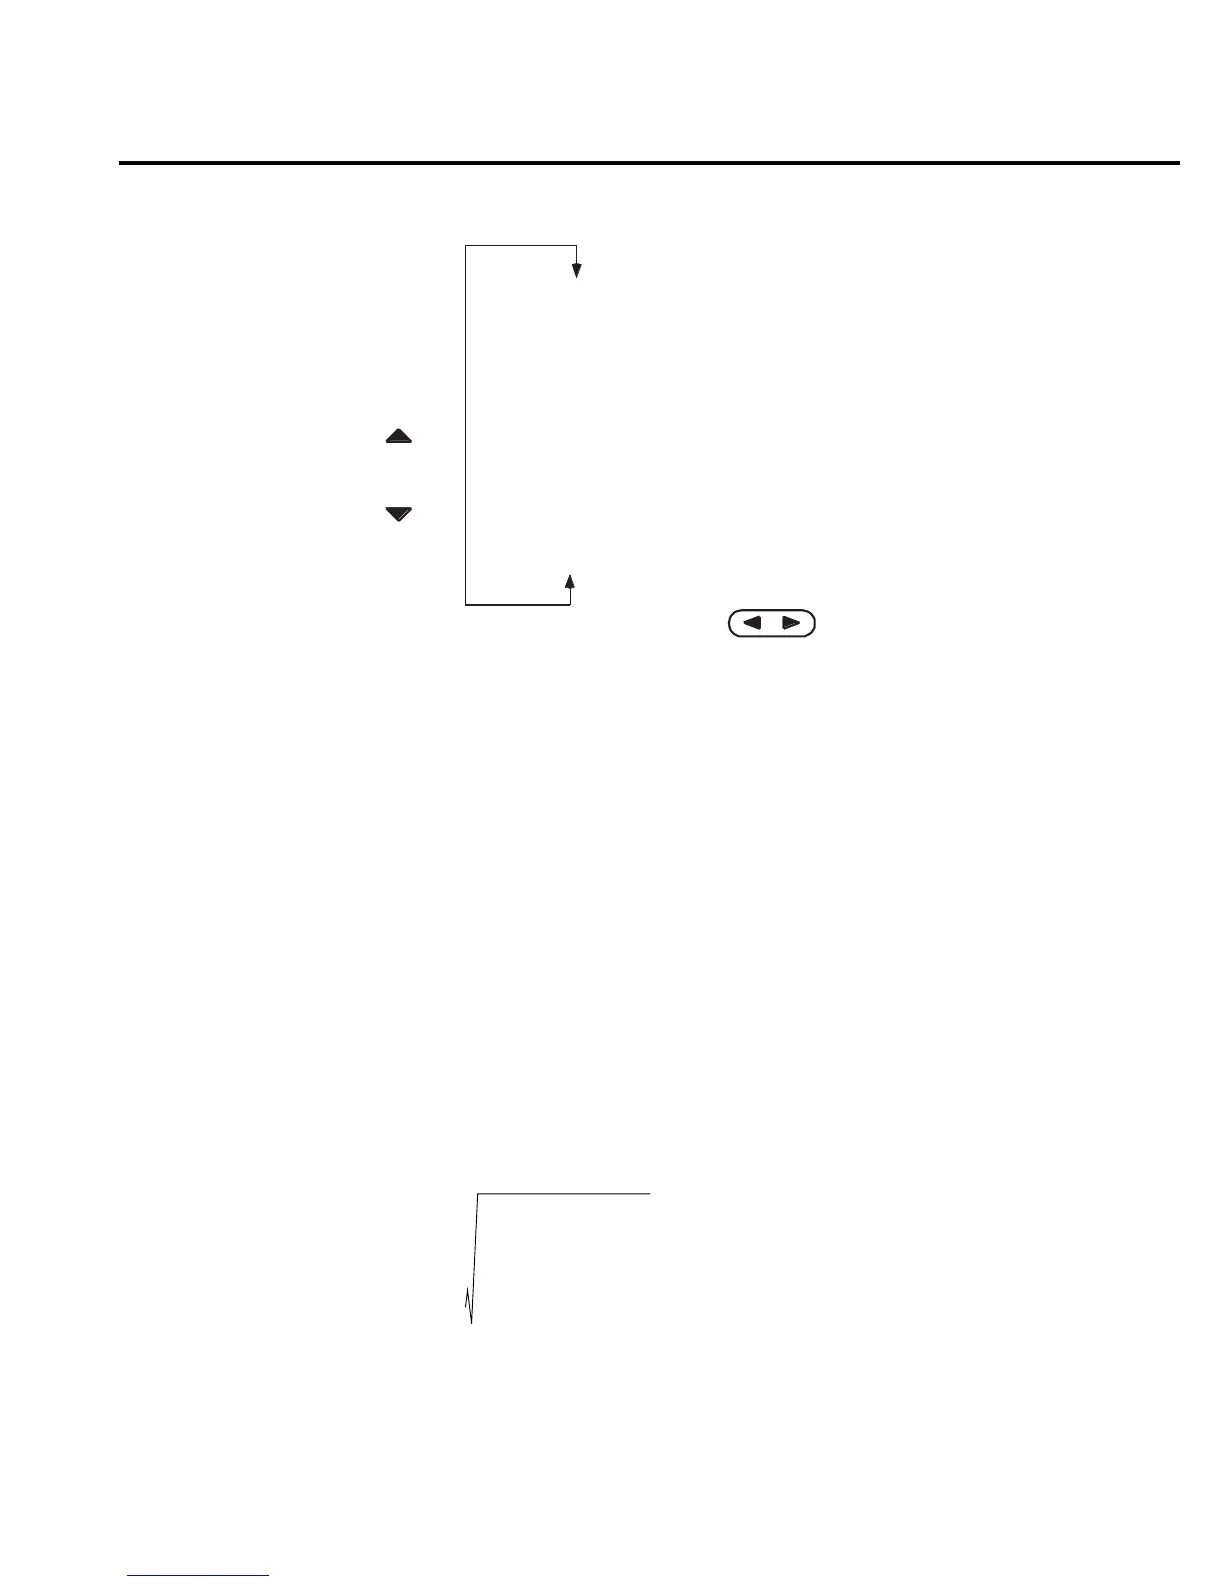
RDG NO. 10 Reading Value Timestamp
RDG NO. 9 Reading Value Timestamp
RDG NO. 8 Reading Value Timestamp
RDG NO. 7 Reading Value Timestamp
RDG NO. 6 Reading Value Timestamp
RDG NO. 5 Reading Value Timestamp
RDG NO. 4 Reading Value Timestamp
RDG NO. 3 Reading Value Timestamp
RDG NO. 2 Reading Value Timestamp
RDG NO. 1 Reading Value Timestamp
STD DEV Standard Deviation Value
Average Average Value
Pk-Pk Peak to Peak Value
Min At XX Minimum Value Timestamp
Max At XX Maximum Value Timestamp
RANGE
RANGE
Figure 8-1
Buffer locations
y
n
Σ
X
i
i=1
n
--------
=
n
Σ
X
i
2
i1=
1
n
---
n
Σ
X
i
i1=
2
–
n1–
---------------------------------------------------=
 Loading...