15.4Chartviews
Switchingbetween2D/3Dchartview
Youcanswitchbetween2Dand3Dviews.
Fromthechartapplication:
1.SelectMenu.
2.SelectPresentation.
3.SelectChartViewtoswitchbetween2Dor3D.
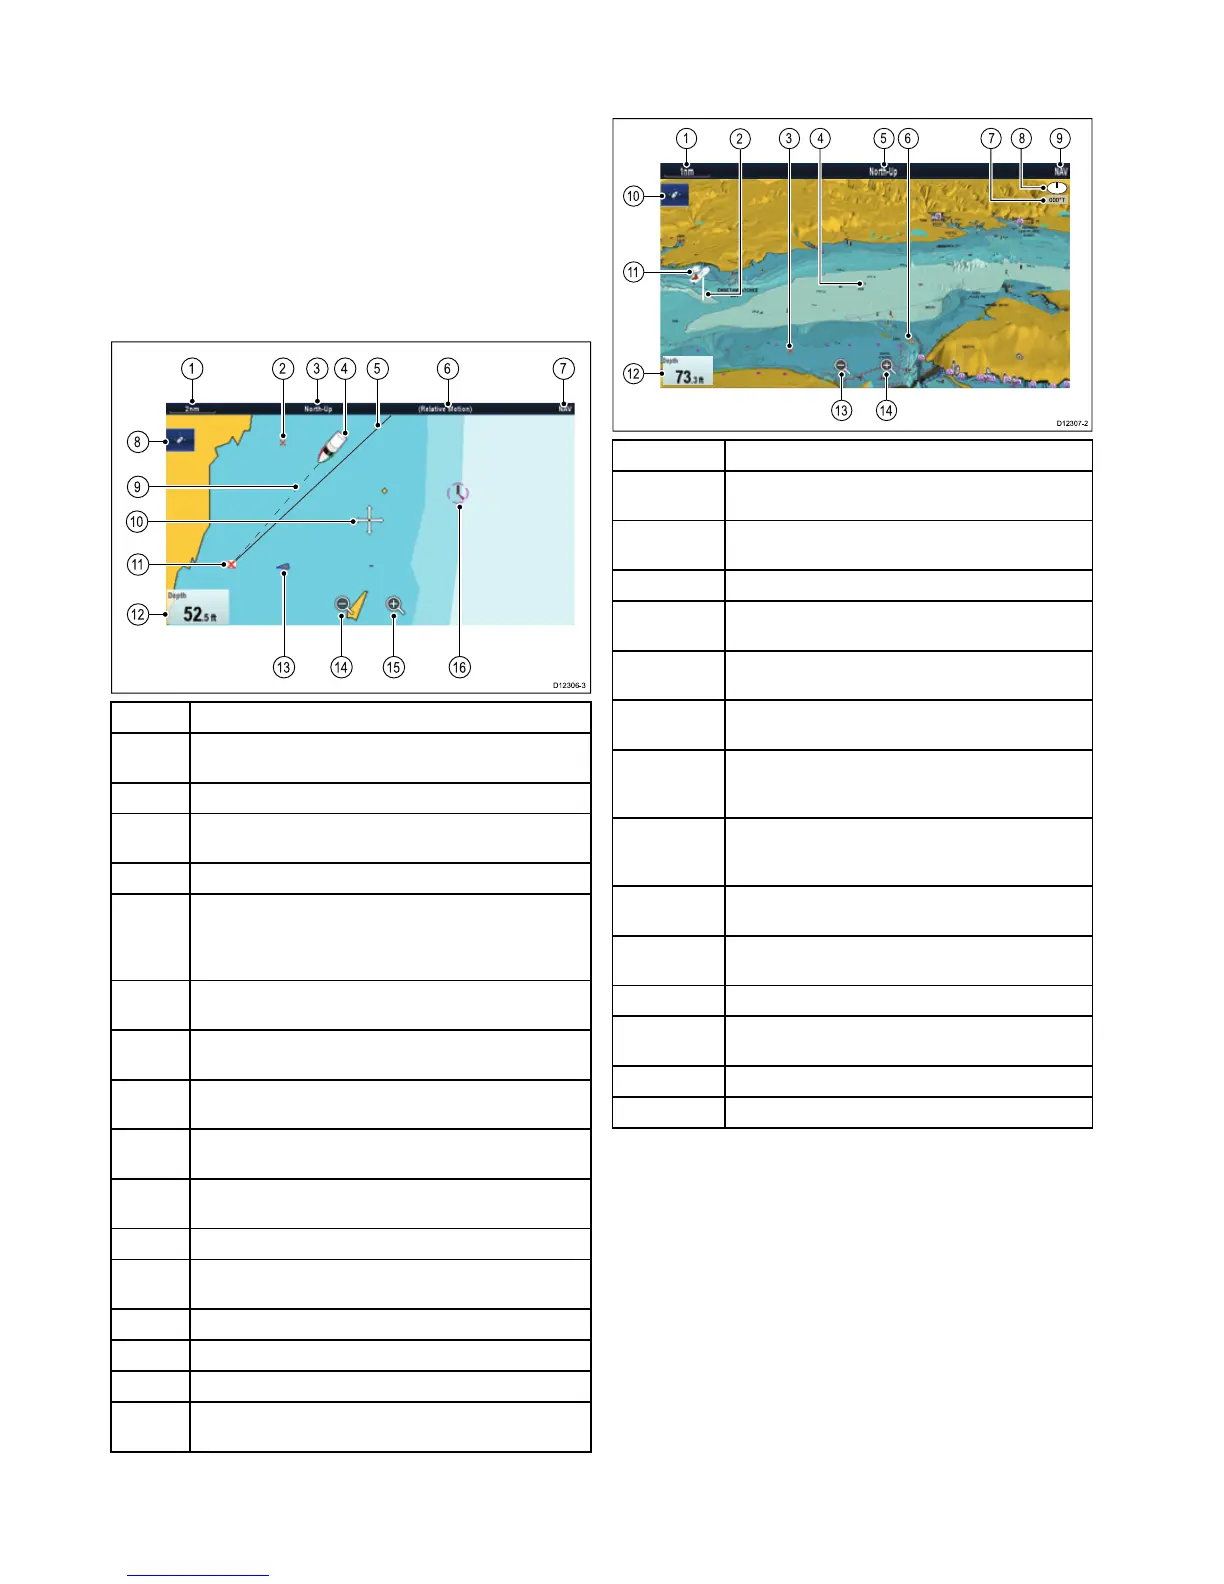
2Dchartview
The2Dchartviewcandisplayarangeofinformationtohelp
younavigate.
D12 30 6-3
1 2 3 6 74 5
14 15 16
13
8
11
9
10
12
ItemDescription
1
Range—horizontalchartscaleindicator(showninselected
systemunits).
2Waypoint—Inactive.
3
Orientation—statestheorientationmodethatthechartis
using(North-up,Head-up,orCourse-up).
4Vesselsymbol—showsyourcurrentposition.
5
Navigationoriginline—Duringnavigation,showsasolid
linefromthestartingpointtothetargetwaypoint.Thestarting
pointcanbethevessel’soriginallocation,thepointofXTE
resetorthepointthecurrentlegofaroutewasinitiated.
6
Motionmode—statesthecurrentmotionmode(Relative,
True,orAutoRange).
7
Charttype—indicatesthetypeofchartinuse—Fishor
Navigation.
8
Findshipicon—usedtondandcenteryourvesselon
thechart.
9Vesselpositionline—Duringnavigation,showsadottedline
fromthevessel’scurrentpositiontothetargetwaypoint.
10
Cursor—usedtoselectchartobjectsandmovearoundthe
chartarea.
11
Targetwaypoint—Currenttargetwaypoint.
12Dataoverlay—usedtodisplaydatasuchasdepthonthe
chartscreen.
13
AIStarget—avesselbroadcastingAISinformation(optional).
14
Rangeout—selecticontorangeout(NeweSeriesonly).
15
Rangein—selecticontorangein(NeweSeriesonly).
16
Cartographicobjects—usetheCartographymenu:Menu>
Set-up>Cartographytochoosewhichobjectstodisplay.
3Dchartview
The3Dviewcandisplayarangeofinformationtohelpyou
navigate.
00 °T
1 5 6 9
10
11
12
3
2
84 7
1413
D12 30 7-2
ItemDescription
1
Range—horizontalchartscaleindicator(shownin
selectedsystemunits).
2
DepthScale—approximatedepthbeneathyourvessel
(optional).
3Waypoint—optional.
4
Center-of-view—thewhitecrossindicatesthecenterof
chartviewatthewaterlevel(optional).
5
Orientation—statestheorientationmodethatthechart
isusing.
6
Cartographicobjects—usetheCartographySet-up
menutochoosewhichobjectstodisplay.
7
Rotation—showsindegreestrue,howfartheon-screen
viewhasbeenrotatedfromyourvessel'sheadingand
thetiltangleofyourvessel.
8
Northarrow–3DindicationofTrueNorthinrelationto
thechartview.Thenortharrowalsotiltstoindicatepitch
angle.
9
Charttype—indicatesthetypeofchartinuse—Fish
orNavigation.
10
Findshipicon—usedtondandcenteryourvessel
onthechart.
11Vesselsymbol—yourvessel'scurrentposition.
12Dataoverlay—usedtodisplaydatasuchasdepthon
thechartscreen.
13
Rangeout—useicontorangeout(NeweSeriesonly).
14
Rangein—useicontorangein(NeweSeriesonly).
Manipulatingthe3Dchartview
Fromthechartapplication:
1.Withthechartin3Dmode,gototheAdjustViewingAngle
menu:Menu>AdjustViewingAngle.
2.SelectAdjust:sothatPitchandrotateishighlighted.
3.T oadjustthepitch:
i.NewcSeriesorNeweSeries—MovetheJoystickUp
orDowntoadjustthepitch
144
NewaSeries/NewcSeries/NeweSeries
 Loading...