20070201
k Selecting Functions for Graphing
u To specify the draw/non-draw status of a graph
1. On the graph relation list, use f and c to highlight the relation you do not want to
graph.
2. Press 1(SEL).
• Each press of 1(SEL) toggles graphing on and off.
3. Press 6(DRAW).
Example To select the following functions for drawing :
Y1 = 2
x
2
– 5, r 2 = 5 sin3
θ
Use the following V-Window settings.
Xmin = –5, Xmax = 5, Xscale = 1
Ymin = –5, Ymax = 5, Yscale = 1
T
θ
min = 0, T
θ
max =
π
, T
θ
ptch = 2
π
/ 60
cf (Select a memory area that contains a function
for which you want to specify non-draw.)
1(SEL) (Specifi es n on-draw.)
6(DRAW) or w (Draws the graphs.)
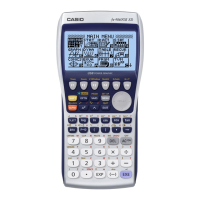
• You can use the Setup screen settings to alter the appearance of the graph screen as
shown below.
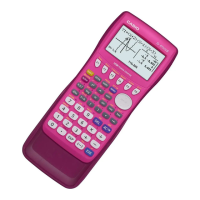
• Grid: On (Axes: On Label: Off)
This setting causes dots to appear at the grid
intersects on the display.
• Axes: Off (Label: Off Grid: Off)
This setting clears the axis lines from the display.
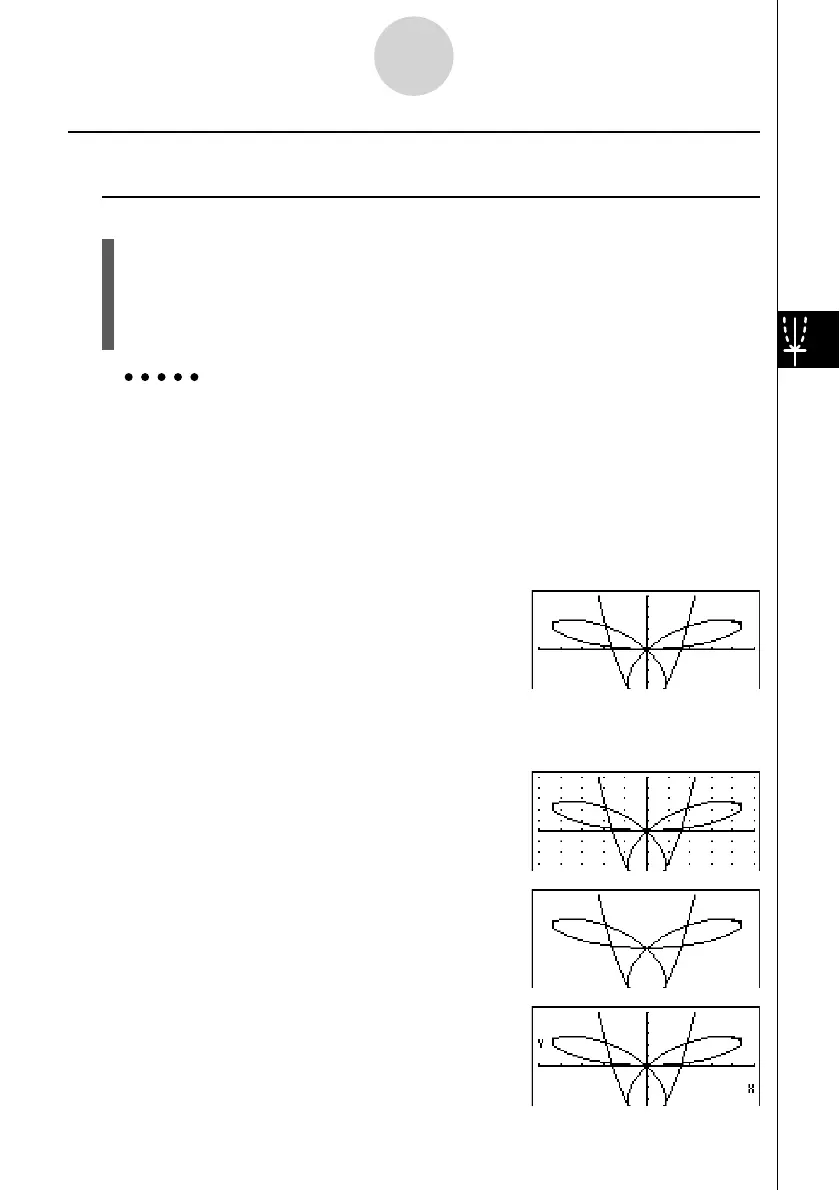
• Label: On (Axes: On Grid: Off)
This setting displays labels for the
x- and y-axes.
5-3-8
Drawing a Graph

 Loading...