20070201
k Displaying the Calculation Results of a Drawn Paired-Variable Graph
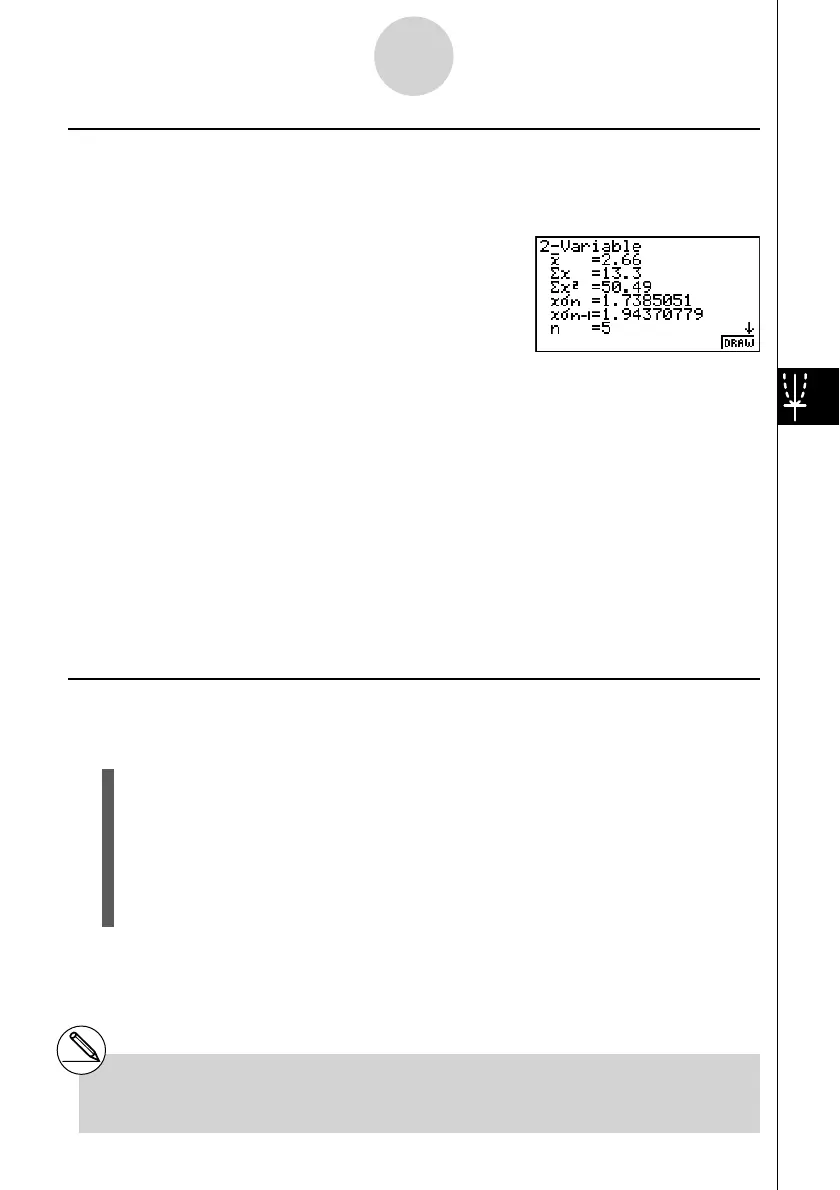
Paired-variable statistics can be expressed as both graphs and parameter values. When
these graphs are displayed, the paired-variable calculation results appear as shown below
when you press 1(CALC)1(2VAR).
• Use c to scroll the list so you can view the items that run off the bottom of the screen.
o ............. mean of data stored in xList
Σ x ........... sum of data stored in x List
Σ x
2
.......... sum of squares of data
stored in xList
x
σ
n .......... population standard
deviation of data stored in
xList
x
σ
n-1 ........ sample standard deviation
of data stored in xList
n ............. number of data
p .............. mean of data stored in yList
Σ y ........... sum of data stored in yList
6-3-11
Calculating and Graphing Paired-Variable Statistical Data
*
1
You cannot edit regression formulas for graph
formulas in the GRAPH mode.
Σ y
2
......sum of squares of data stored in yList
y
σ
n ......population standard deviation of data
stored in yList
y
σ
n-1 ....sample standard deviation of data
stored in yList
Σ xy.......sum of the product of data stored in
xList and yList
minX ....minimum of data stored in xList
maxX ...maximum of data stored in xList
minY ....minimum of data stored in yList
maxY ...maximum of data stored in yList
k Copying a Regression Graph Formula to the GRAPH Mode
You can copy regression formula calculation results to the GRAPH mode graph relation list,
and store and compare.
1. While a regression calculation result is on the display (see “Displaying Regression
Calculation Results” on page 6-3-5), press 5(COPY).
• This will display the GRAPH mode graph relation list.*
1
2. Use f and c to highlight the area to which you want to copy the regression formula
of the displayed result.
3. Press w to save the copied graph formula and return to the previous regression
calculation result display.

 Loading...