20070201
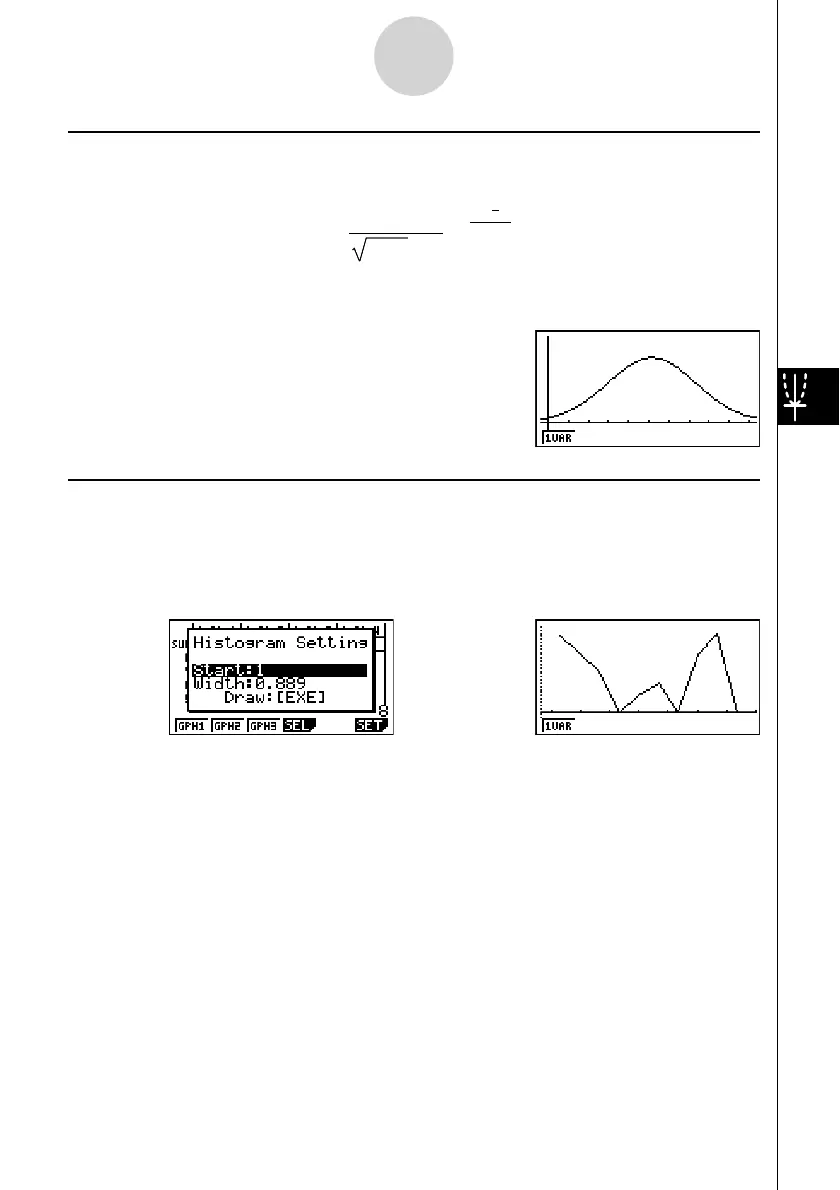
k Normal Distribution Curve (N
•
Dis)
The normal distribution curve is graphed using the following normal distribution function.
XList specifi es the list where the data is input, while Freq specifi es the list where the data
frequency is input. 1 is specifi ed for Freq when frequency is not specifi ed.
k Broken Line Graph (Brkn)
Lines connect center points of a histogram bar.
XList specifi es the list where the data is input, while Freq specifi es the list where the data
frequency is input. 1 is specifi ed for Freq when frequency is not specifi ed.
w(Draw)
The display screen appears as shown above before the graph is drawn. At this point, you can
change the Start and Width values.
=
1
(2 π) xσn
e
–
2xσ
n
2
(
x–
x
)
2
=
1
(2 π) xσn
e
–
2xσ
n
2
(
x–
x
)
2
⇒⇒
6-2-3
Calculating and Graphing Single-Variable Statistical Data

 Loading...