20070201
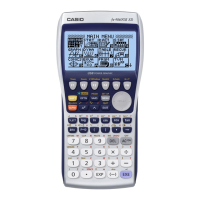
k Logarithmic Regression Graph
Logarithmic regression expresses y as a logarithmic function of x. The standard logarithmic
regression formula is y = a + b × In x, so if we say that X = In x, the formula corresponds to
linear regression formula y = a + bX.
1(CALC)6(g)2(Log)
6(DRAW)
The following is the logarithmic regression model formula.
y = a + b·ln x
a
...............regression constant term
b............... regression coeffi cient
r ............... correlation coeffi cient
r
2
.............coeffi cient of determination
MSe ........mean square error
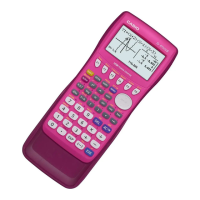
k Exponential Regression Graph
Exponential regression expresses y as a proportion of the exponential function of x. The
standard exponential regression formula is y = a × e
bx
, so if we take the logarithms of both
sides we get In y = In a + bx. Next, if we say Y = In y, and A = In a, the formula corresponds
to linear regression formula Y = A + bx.
1(CALC)6(g)3(Exp)
6(DRAW)
The following is the exponential regression model formula.
y = a·e
bx
a...............regression coeffi cient
b...............regression constant term
r ...............correlation coeffi cient
r
2
.............coeffi cient of determination
MSe ........mean square error
6-3-8
Calculating and Graphing Paired-Variable Statistical Data

 Loading...