20070201
6-2 Calculating and Graphing Single-Variable
Statistical Data
Single-variable data is data with only a single variable. If you are calculating the average
height of the members of a class for example, there is only one variable (height).
Single-variable statistics include distribution and sum. The following types of graphs are
available for single-variable statistics.
You can also use the procedures under “Changing Graph Parameters” on page 6-1-2 to
make the settings you want before drawing each graph.
k Normal Probability Plot (NPP)
This plot compares the data accumulated ratio with a normal distribution accumulated ratio.
XList specifi es the list where data is input, and Mark Type is used to select from among the
marks { / × / • }you want to plot.
Press A, J or !J(QUIT) to return to the statistical data list.
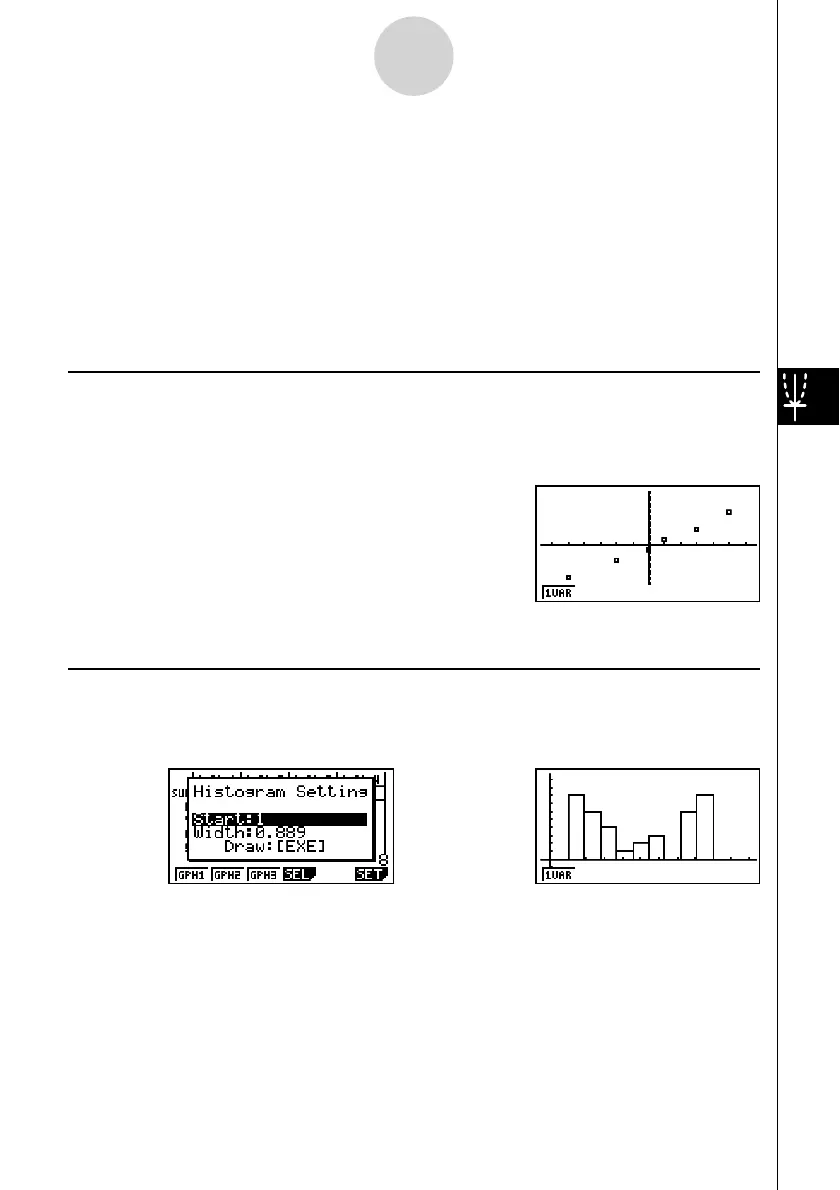
k Histogram ( Bar Graph) (Hist)
XList specifi es the list where the data is input, while Freq specifi es the list where the data
frequency is input. 1 is specifi ed for Freq when frequency is not specifi ed.
w(Draw)
The display screen appears as shown above before the graph is drawn. At this point, you can
change the Start and Width values.
⇒⇒
6-2-1
Calculating and Graphing Single-Variable Statistical Data

 Loading...