4 Configuration DGS-1210 series Metro Ethernet Managed Switch User Manual
1
1
1
1
3
3
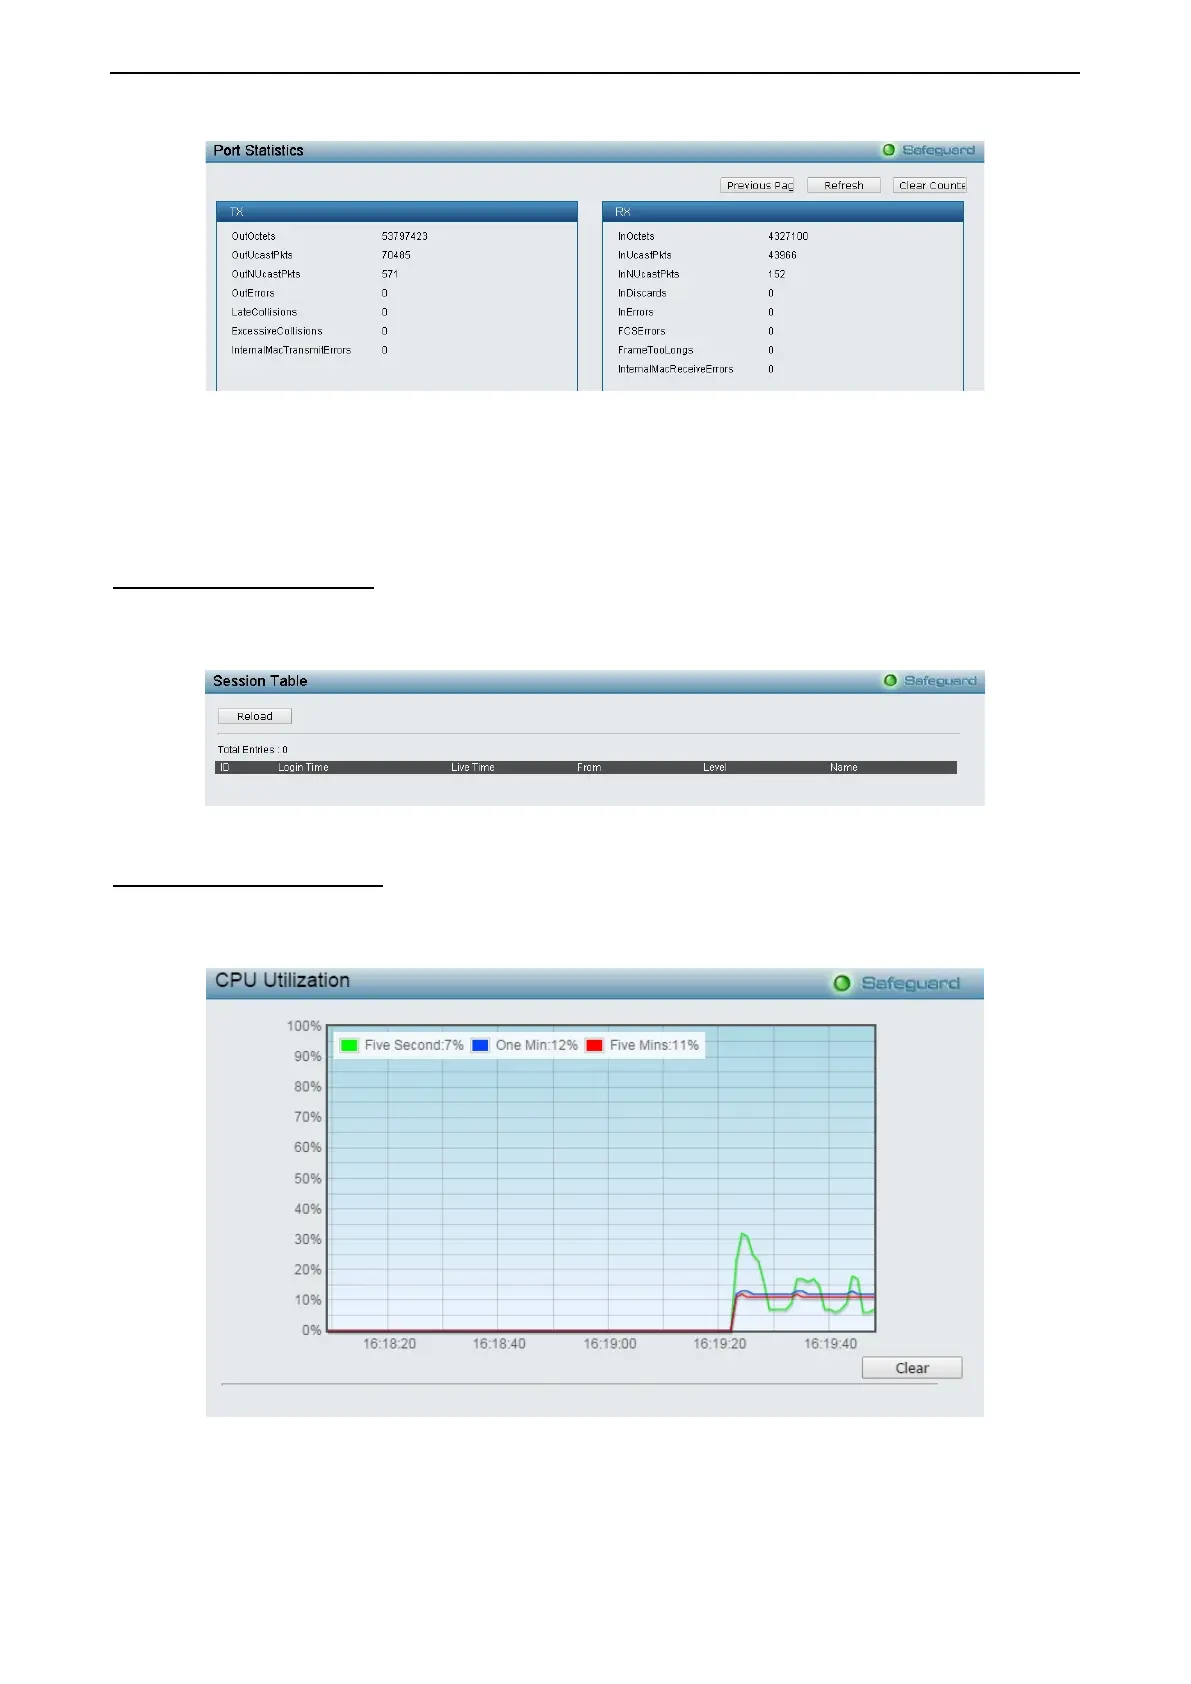
Figure 4.171 – Monitoring > Port Statistics
Previous Page: Go back to the Statistics main page.
Refresh: To renew the details collected and displayed.
Clear Counter: To reset the details displayed.
Monitoring > Session Table
The Session Table allows the user to view detailed information on the current configuration session of the
Switch. Information such as the Session ID of the user, initial Login Time, Live Time, configuration
connection From the Switch, Level and Name of the user are displayed. Click Reload to refresh this window.
Figure 4.172 – Monitoring > Session Table
Monitoring > CPU Utilization
The CPU Utilization displays the percentage of the CPU being used, expressed as an integer percentage
and calculated as a simple average by time interval. The window will automatically refresh with new updated
statistics.
Figure 4.173 – Monitoring > CPU Utilization
Clear: Clicking this button clears all statistics counters on this window.

 Loading...