80
70
60
50
40
30
20
10
0
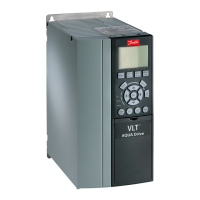
Recirculation
Throttle
control
Cycle
control
VSD
control
Ideal pump
control
Q(%)
P(%)
Illustration 10: Comparative Flow Control Curves
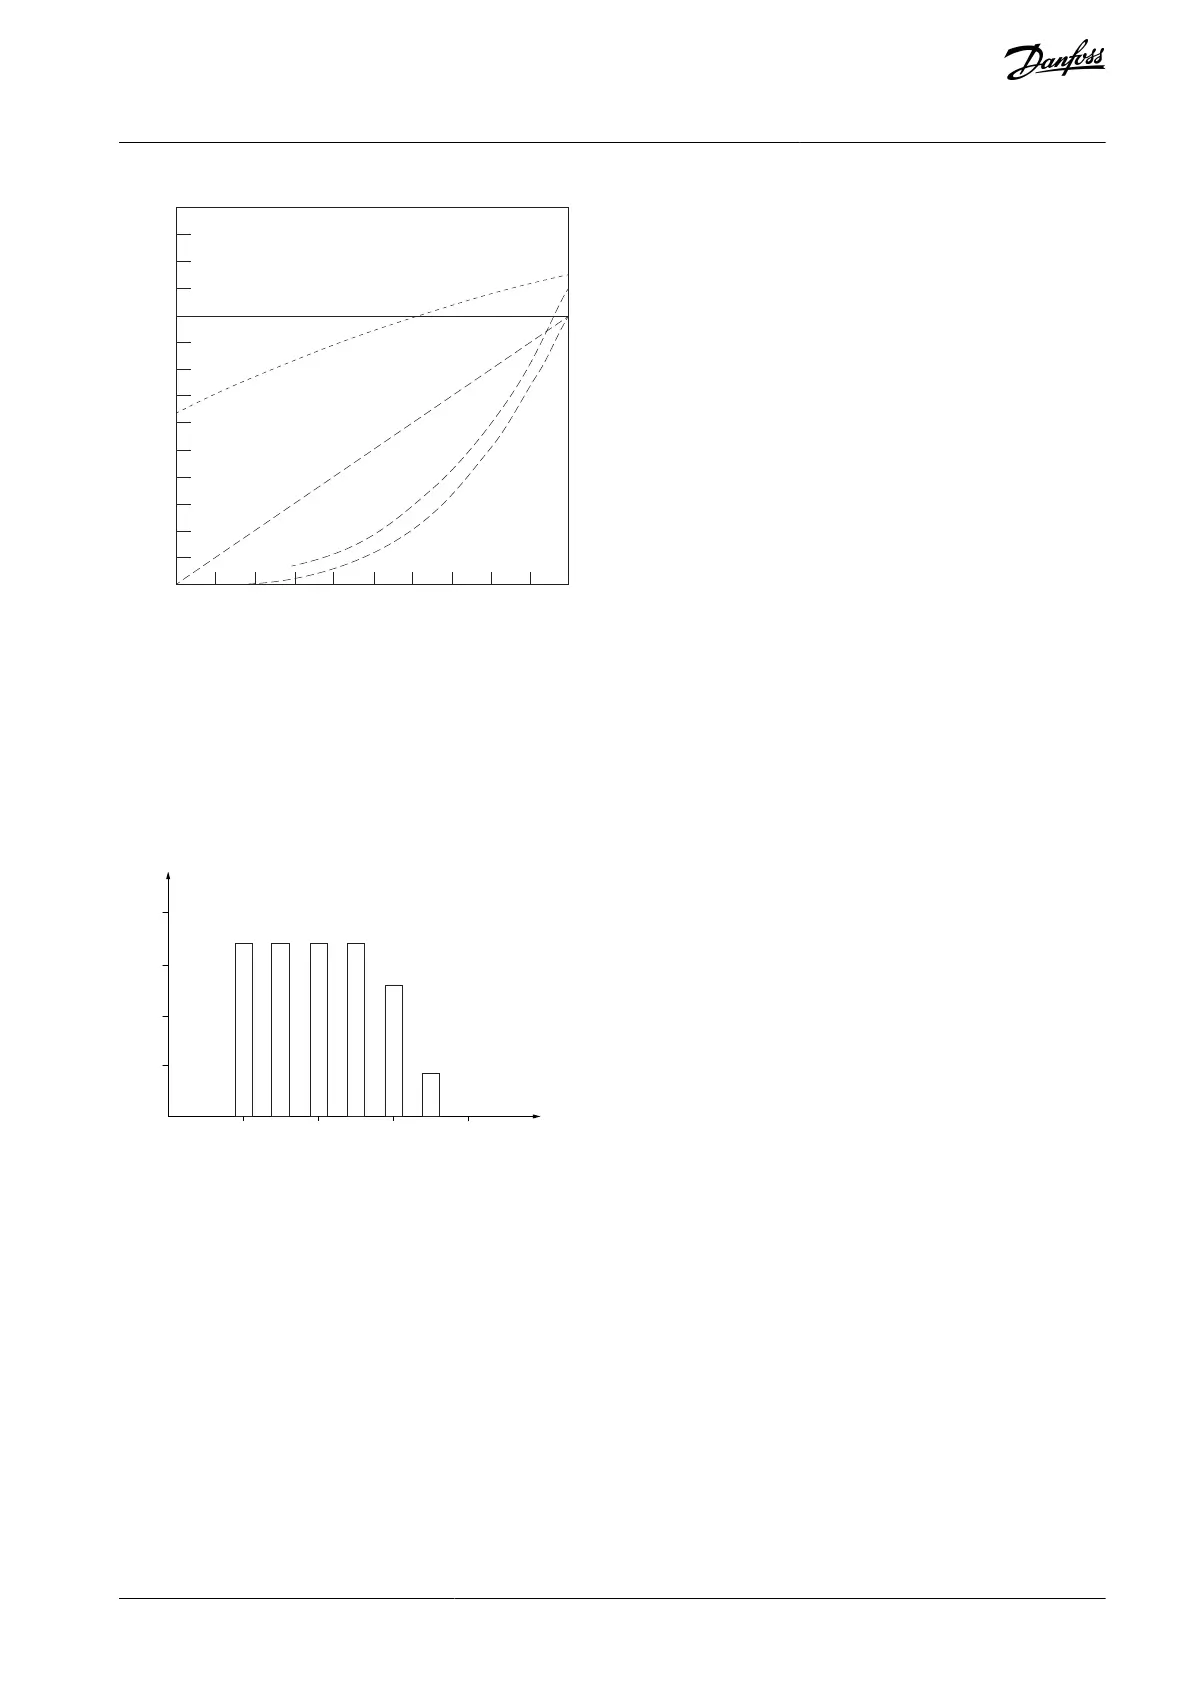
4.3.3 Example with Varying Flow over 1 Year
This example is calculated based on pump characteristics obtained from a pump datasheet. The result obtained shows energy sav-
ings of more than 50% at the given ow distribution over a year. The payback period depends on the price per kWh and the price of
frequency converter. In this example, it is less than a year when compared with valves and constant speed.
Energy savings
P
shaft
= P
shaft output
200100
300
[m
3
/h]
400
Q
e75ha210.11
Illustration 11: Flow Distribution over 1 Year
AJ300847815559en-000101 / 130R0337 | 25Danfoss A/S © 2020.09
Product Family Overview
VLT® AQUA Drive FC 202
Design Guide
 Loading...