The following describes the columns in the monitoring table.
Column Description
Source Source of a symbol
Identifier Identifier of a symbol
Device name Name of a monitored device
Status State of a monitored bit device or a contact (ON or OFF).
Data type Data type of a monitored symbol.
Value (16 bits) In online mode, displays a 16-bit value.
Value (32 bits) In online mode, displays a 32-bit value.
Value (32-bit
floating-point
value)
In online mode, displays a 32-bit floating-point number.
Value (64-bit
floating-point
value)
In online mode, displays a 64-bit floating-point number.
Radix Select a format to represent a value.
Comment Display the comments on a device or on a symbol.
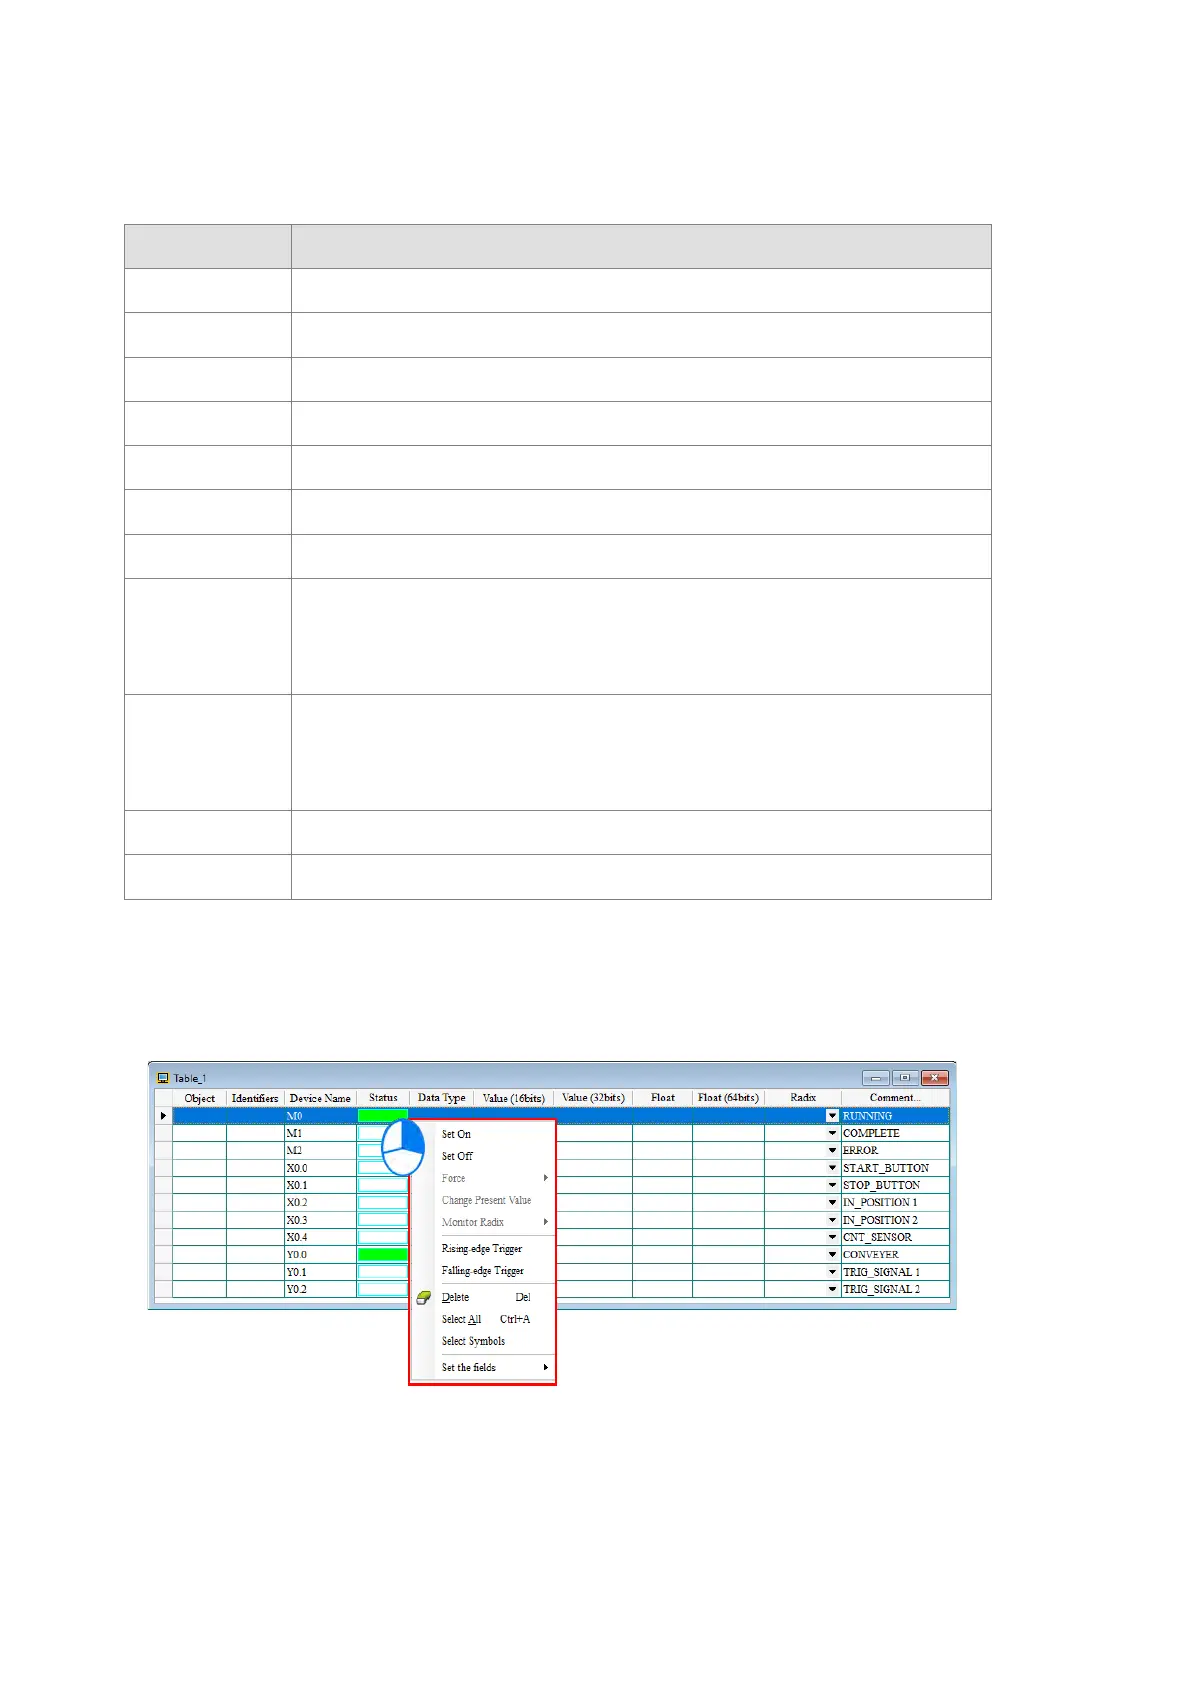
After you create the monitoring table, you can monitor the items in the monitoring table in online mode. Right-
click an item in the monitoring table in online mode to display a context menu which is the same as the context
menu in the program editing window. You can change the item state or the item value by clicking an item in
this context menu.
You can text and debug the program you created in this chapter through the monitoring table you created in
this section. Refer to Chapter 18 in the ISPSoft User Manual for more information about testing and debugging
a program.
Send Quote Requests to info@automatedpt.com
Call +1(800)985-6929 To Order or Order Online At Deltaacdrives.com
Send Quote Requests to info@automatedpt.com
Call +1(800)985-6929 To Order or Order Online At Deltaacdrives.com
 Loading...