4 Basic Operations and Status Check
4-12
NJ/NX-series Database Connection CPU Units User’s Manual (W527)
4-3-4 Checking the Status of each DB Connection
You can use the following methods to check the status of each DB Connection.
Connection Monitor Table of Sysmac Studio
DB_GetConnectionStatus (Get DB Connection Status) instruction
Checking the Status with Connection Monitor Table of Sysmac Studio
Right-click DB Connection Settings under Configurations and Setup - Host Connection
Settings - DB Connection in the Multiview Explorer and select Connection Monitor Table
from the menu while online with an NJ/NX-series CPU Unit.
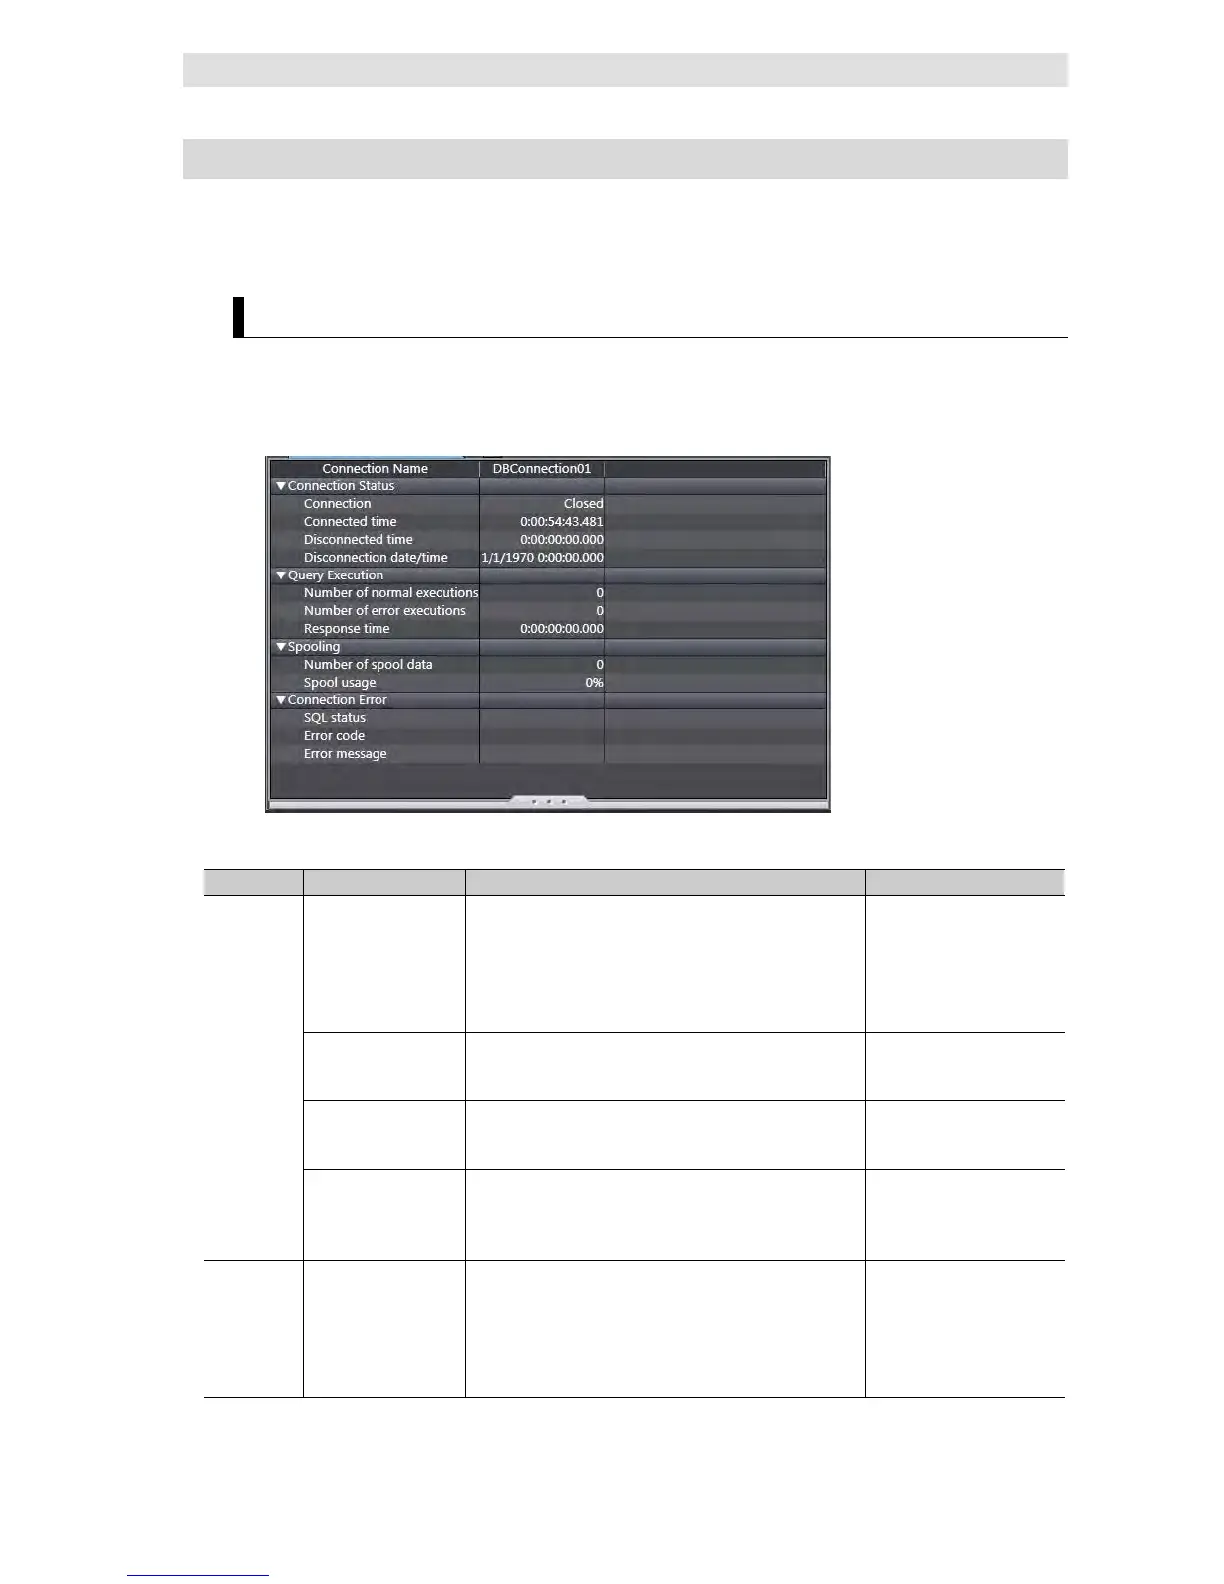
The following Connection Monitor Table Tab Page is displayed.
You can monitor the following of each DB Connection unless the operation status of the DB
Connection Service is Idle or Shutdown.
Category
Connection
Status
Connection Status of the DB Connection. - Closed
- Connected
- Disconnected
Refer to 4-3-3 Connection
Status of each DB
Connected time Total time when the DB is connected.
This value is cleared when Connection changes from
Duration
(Unit: d:h:m:s.ms)
Disconnected time Total time when the DB is disconnected due to an error.
This value is cleared when Connection changes from
Duration
(Unit: d:h:m:s.ms)
Disconnection
date/time
Date and time when the DB is disconnected due to a
network failure, server’s problem, or other causes.
*1
This value is cleared when the DB Connection Service is
Date and time
Query
Execution
Number of normal
executions
Number of times when an SQL statement is normally
executed.
Including the number of times when a spooled SQL
statement is resent.
This value is cleared when the DB Connection Service is
Number of normal
executions
 Loading...