Behavior
The instrument interpolates waveforms in Zoom mode when there is less than one sample for each pixel column. These
functions are performed on the acquired data as compared to the displayed data.
■
Click Sin(x)/x to compute record points along a curve between the actual acquired samples. This form of interpolation is
useful when acquiring rounded waveforms such as sine waves. It is good for general-purpose uses but may introduce
overshoot or undershoot in signals with fast rise times. This interpolation is also useful for looking at high-frequency signals,
especially where the frequency components are just below the Nyquist frequency.
■
Click Linear to compute record points between actual acquired samples using a straight-line fit. This interpolation is useful
for measuring waveforms with fast rise times, such as pulse trains.
TIP. Use the Display menu Waveform Interpolation submenu to directly access the interpolation options. You may want to
set the display style so that the real samples are intensified and interpolated samples are dimmed.
What do you want to do next?
Learn about using text with screen displays.
Learn about changing the appearance of objects in the display.
Learn about changing the display colors.
Nyquist frequency
The highest frequency that any digital oscilloscope can measure without errors is one-half of the sample rate or frequency. This
frequency is called the Nyquist frequency.
The FFT waveform displays the input signal frequency components from DC (0 Hz) to the Nyquist frequency.
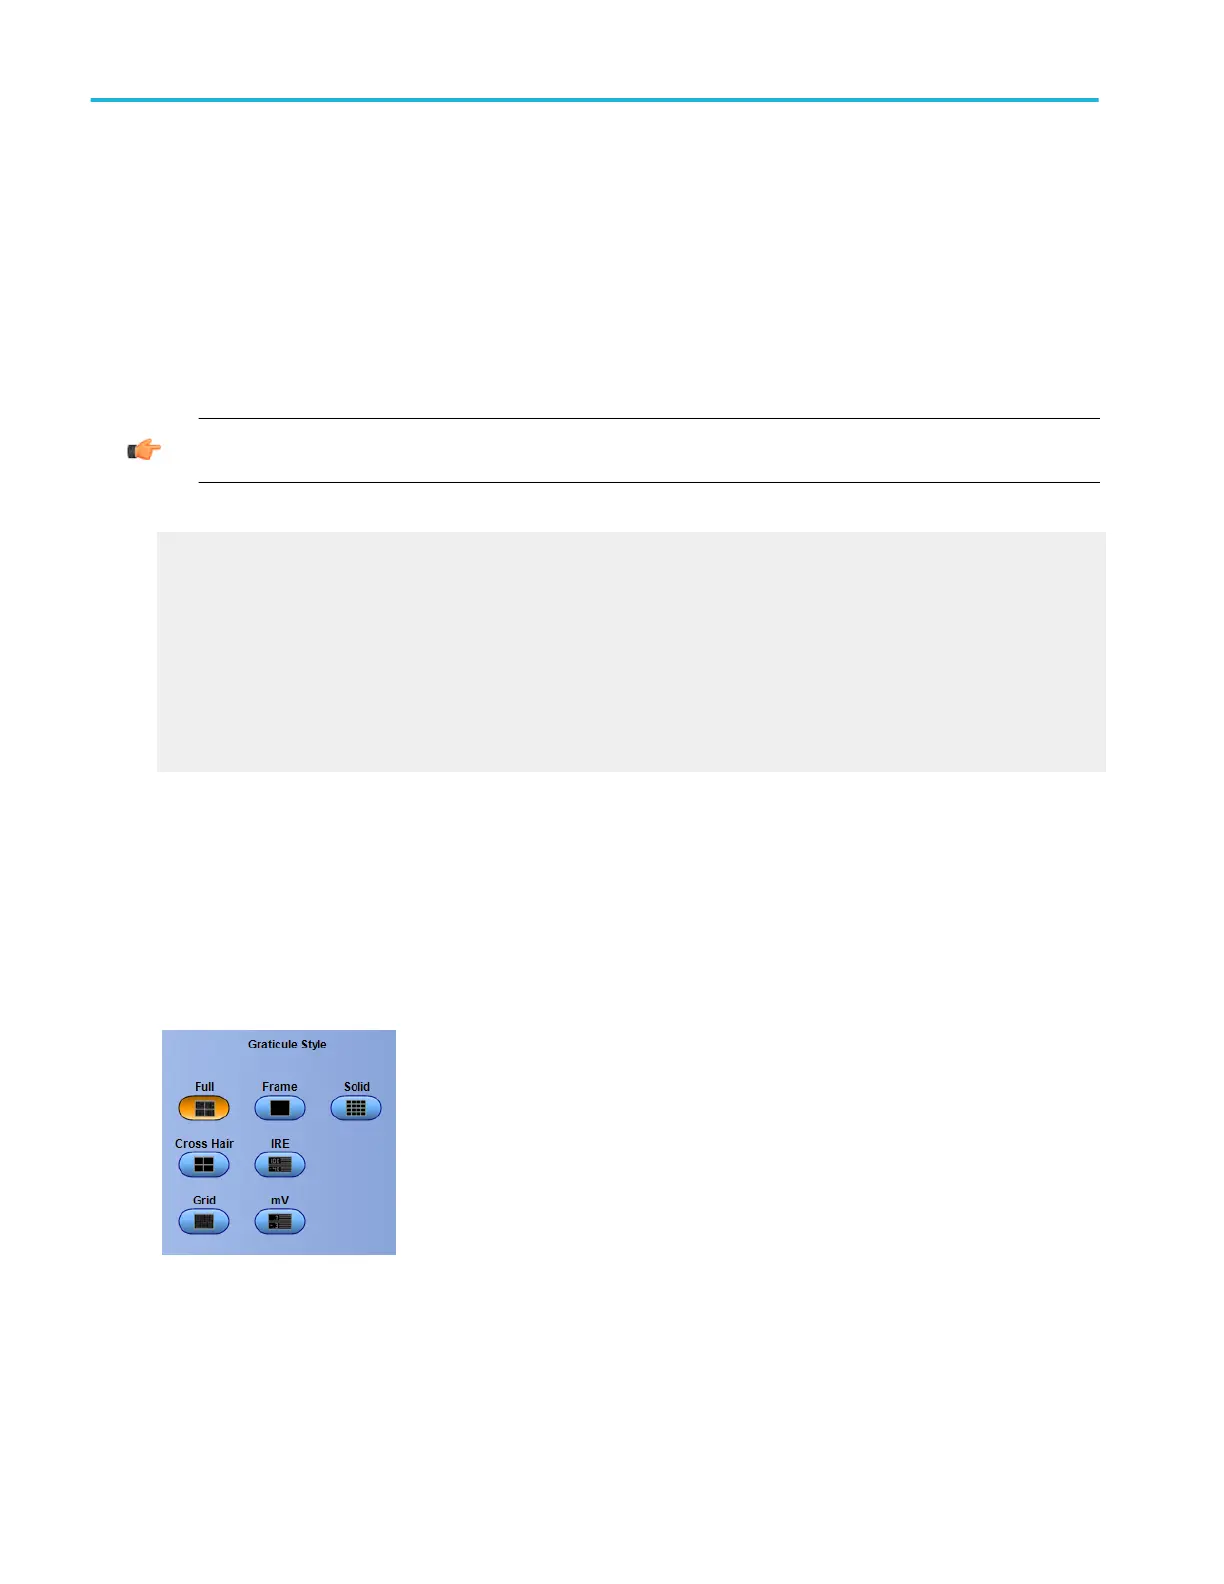
Select the graticule style
From the Display menu, select Objects, or open the Objects tab in the Display control window.
To use
Click one of the buttons to select the graticule (display grid) style.
Display setups
176 DPO70000SX, MSO/DPO70000DX, MSO/DPO70000C, DPO7000C, and MSO/DPO5000B Series
 Loading...


