xStack® DES-3200 Series Layer 2 Managed Fast Ethernet Switch
256
Chapter 11 Monitoring
Utilization
Statistics
Mirror
Ping Test
Trace Route
Peripheral
Utilization
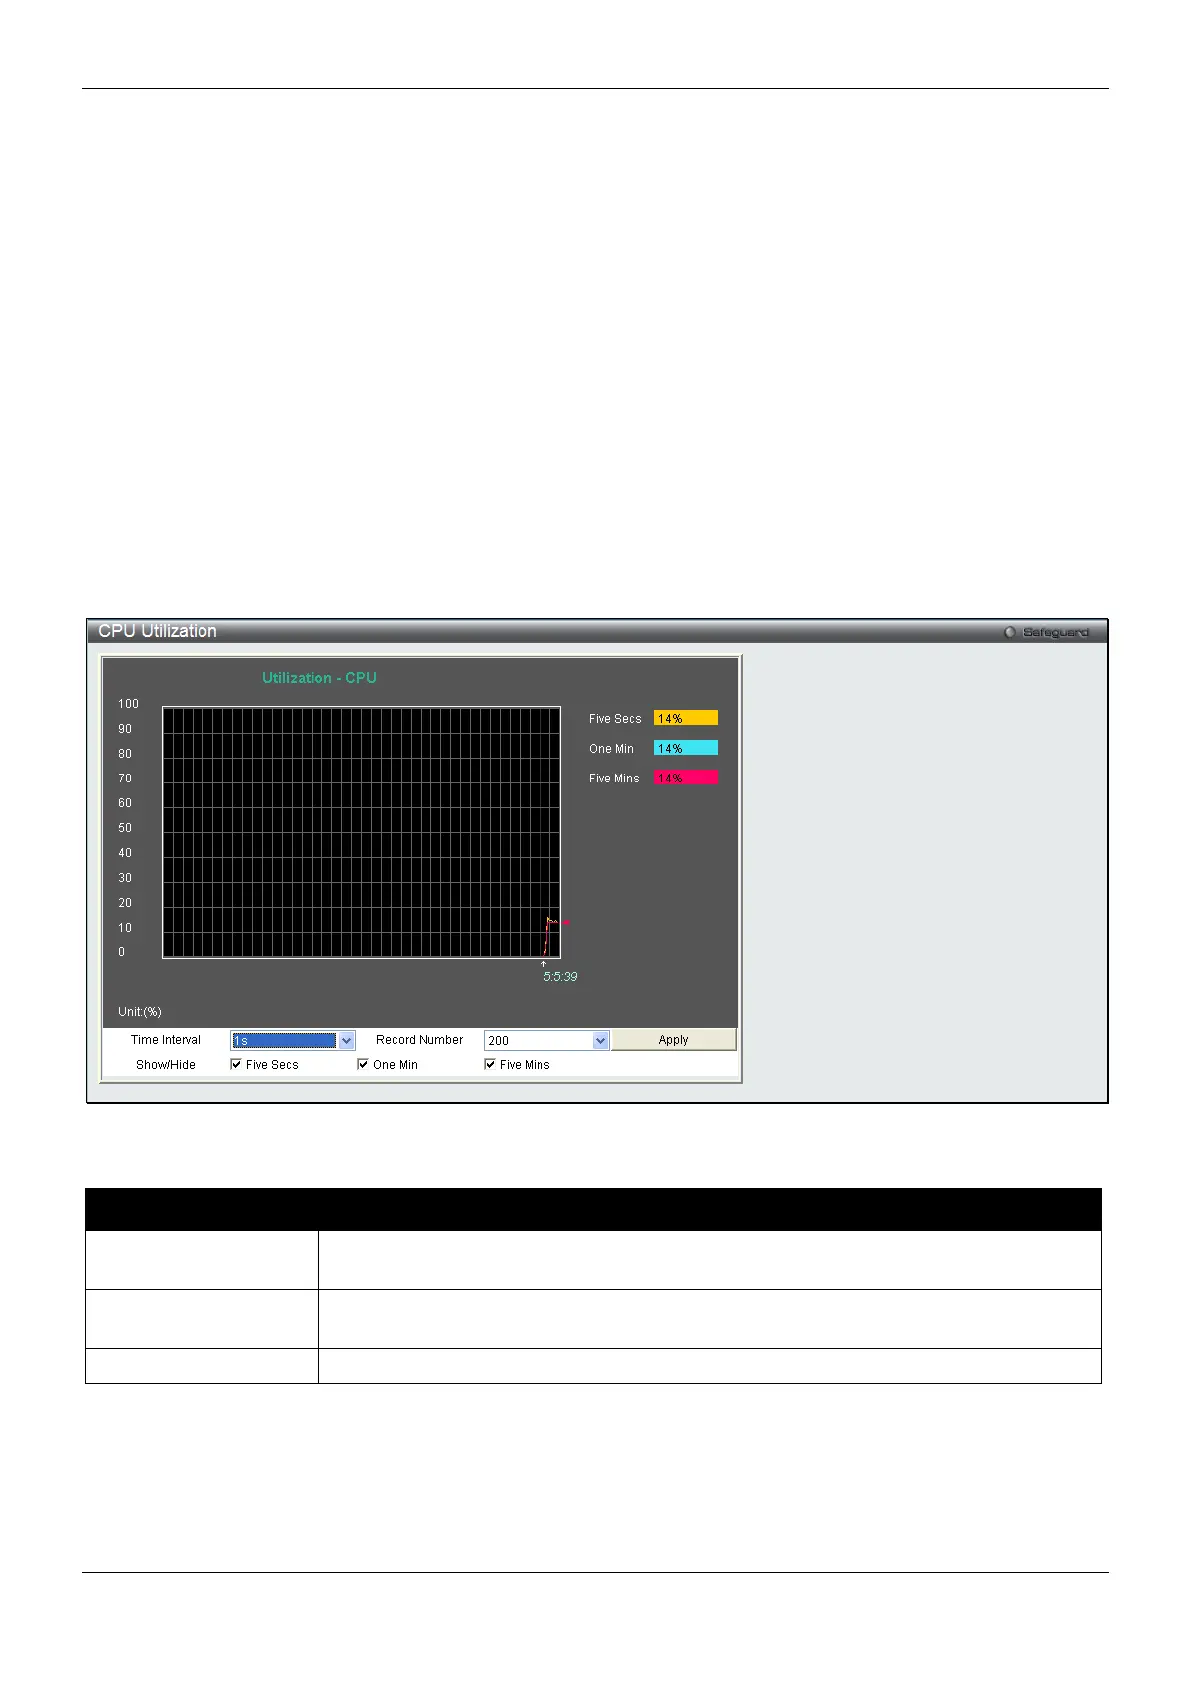
CPU Utilization
Users can display the percentage of the CPU being used, expressed as an integer percentage and calculated as a
simple average by time interval.
To view this window, click Monitoring > Utilization > CPU Utilization as shown below:
Figure 11-1 CPU Utilization window
The fields that can be configured are described below:
Parameter Description
Time Interval Select the desired setting between 1s and 60s, where "s" stands for seconds. The
default value is one second.
Record Number Select number of times the Switch will be polled between 20 and 200. The default
Check whether or not to display Five Secs, One Min, and Five Mins.
Click the Apply button to accept the changes made.
DRAM & Flash Utilization
On this page the user can view information regarding the DRAM and Flash utilization.
To view this window, click Monitoring > Utilization > DRAM & Flash Utilization as shown below:
 Loading...