xStack
®
DGS-3426G Layer 2 Gigabit Ethernet Managed Switch
303
VLANIngDr
Incremented for each packet that is discarded by VLAN ingress checking.
Show/Hide
Check whether or not to display CRC Error, Under Size, Over Size, Fragment, Jabber, and
Drop errors.
Clear
Clicking this button clears all statistics counters on this window.
View Table Clicking this button instructs the Switch to display a table rather than a line graph.
View Line Chart Clicking this button instructs the Switch to display a line graph rather than a table.
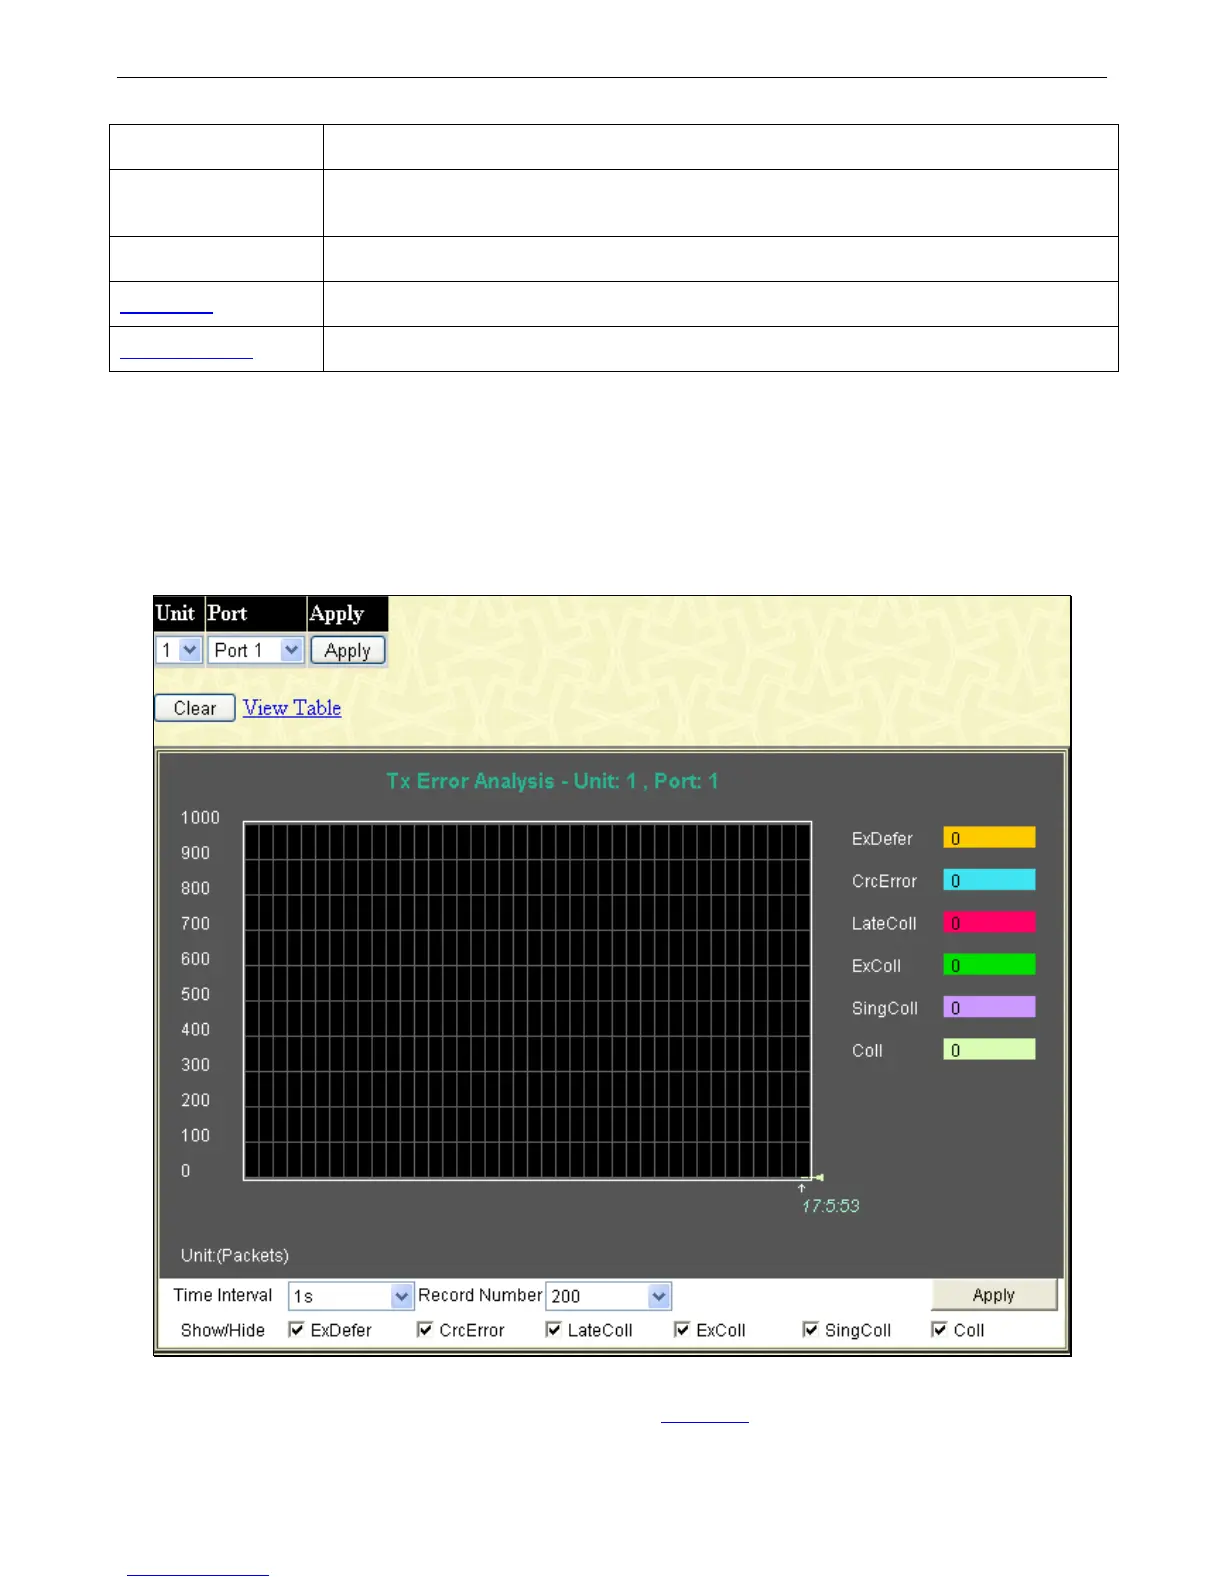
Transmitted (TX)
To select a port to view these statistics for, first select the Switch in the switch stack by using the Unit drop-down menu and then
select the port by using the Port drop-down menu. The user may also use the real-time graphic of the Switch and/or switch stack
at the top of the web page by simply clicking on a port.
To view this window, click, Monitoring > Errors > Transmitted (TX), as shown below:
Figure 7 - 15 Tx Error Analysis (line graph)
To view the Transmitted Error Packets Table window, click the link View Table, which will show the following table:
 Loading...