Statistics 2Var app 93
Here are the statistics displayed when you press .
Plotting Once you have entered your data (
M
), defined your
data set and your fit model (
Y
), you can plot your
data. You can plot up to five scatter plots at a time.
To plot statistical
data
1. In Symbolic view (
Y
), select ( ) the data sets
you want to plot.
2. Adjust the plotting scale and range in the Plot Setup
view.
3. PressP. If you have not adjusted the Plot Setup
yourself, you can try
Vselect Auto Scale .
Auto Scale can be relied upon to give a good starting
scale which can then be adjusted in the Plot Setup.
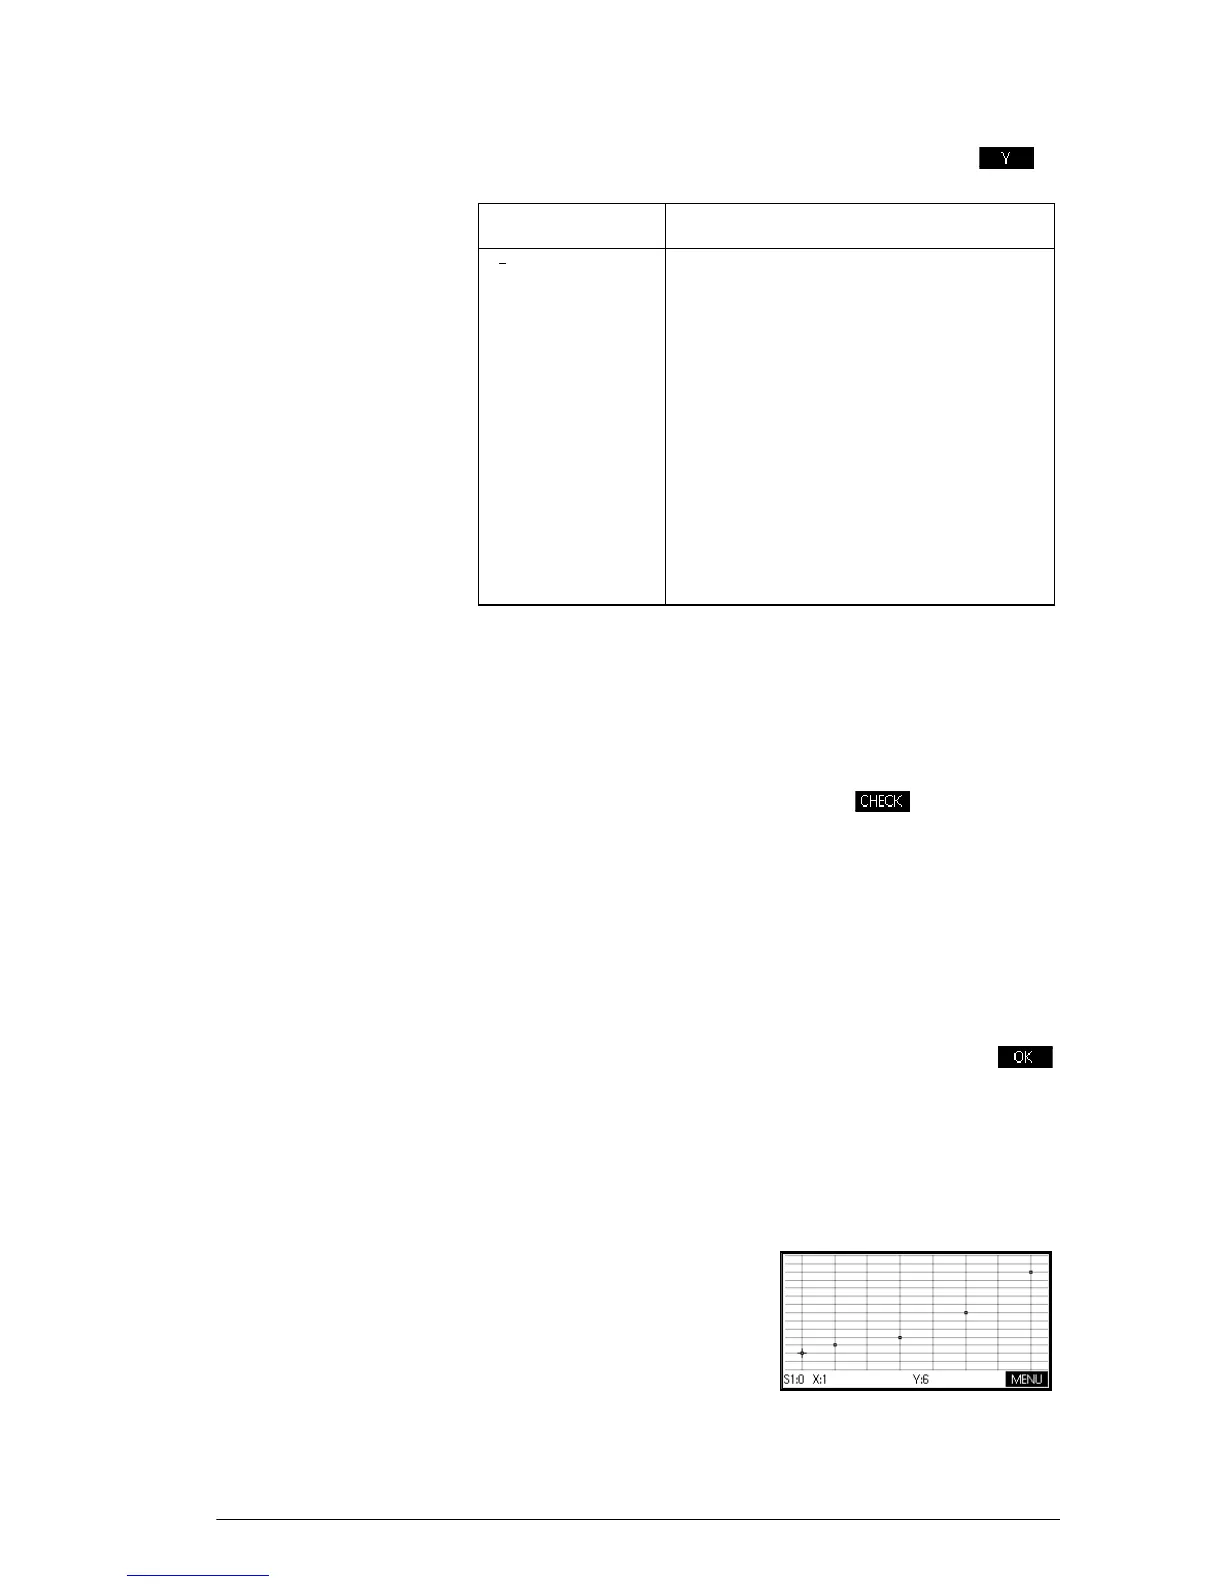
Tracing a Scatter
Plot
The numbers below the plot
indicate that the cursor is at
the first data point for S1, at
(1, 6). Press
>to move to
the next data point and
display information about it.
Statistic Definition
Mean of y- (dependent) values.
ΣY Sum of y-values.
ΣY
2
Sum of y
2
-values.
sY The sample standard deviation of
the dependent column.
Y The population standard deviation
of the dependent column.
serrY The standard error of the
dependent column.
 Loading...