80 Statistics 1Var app
Plot types
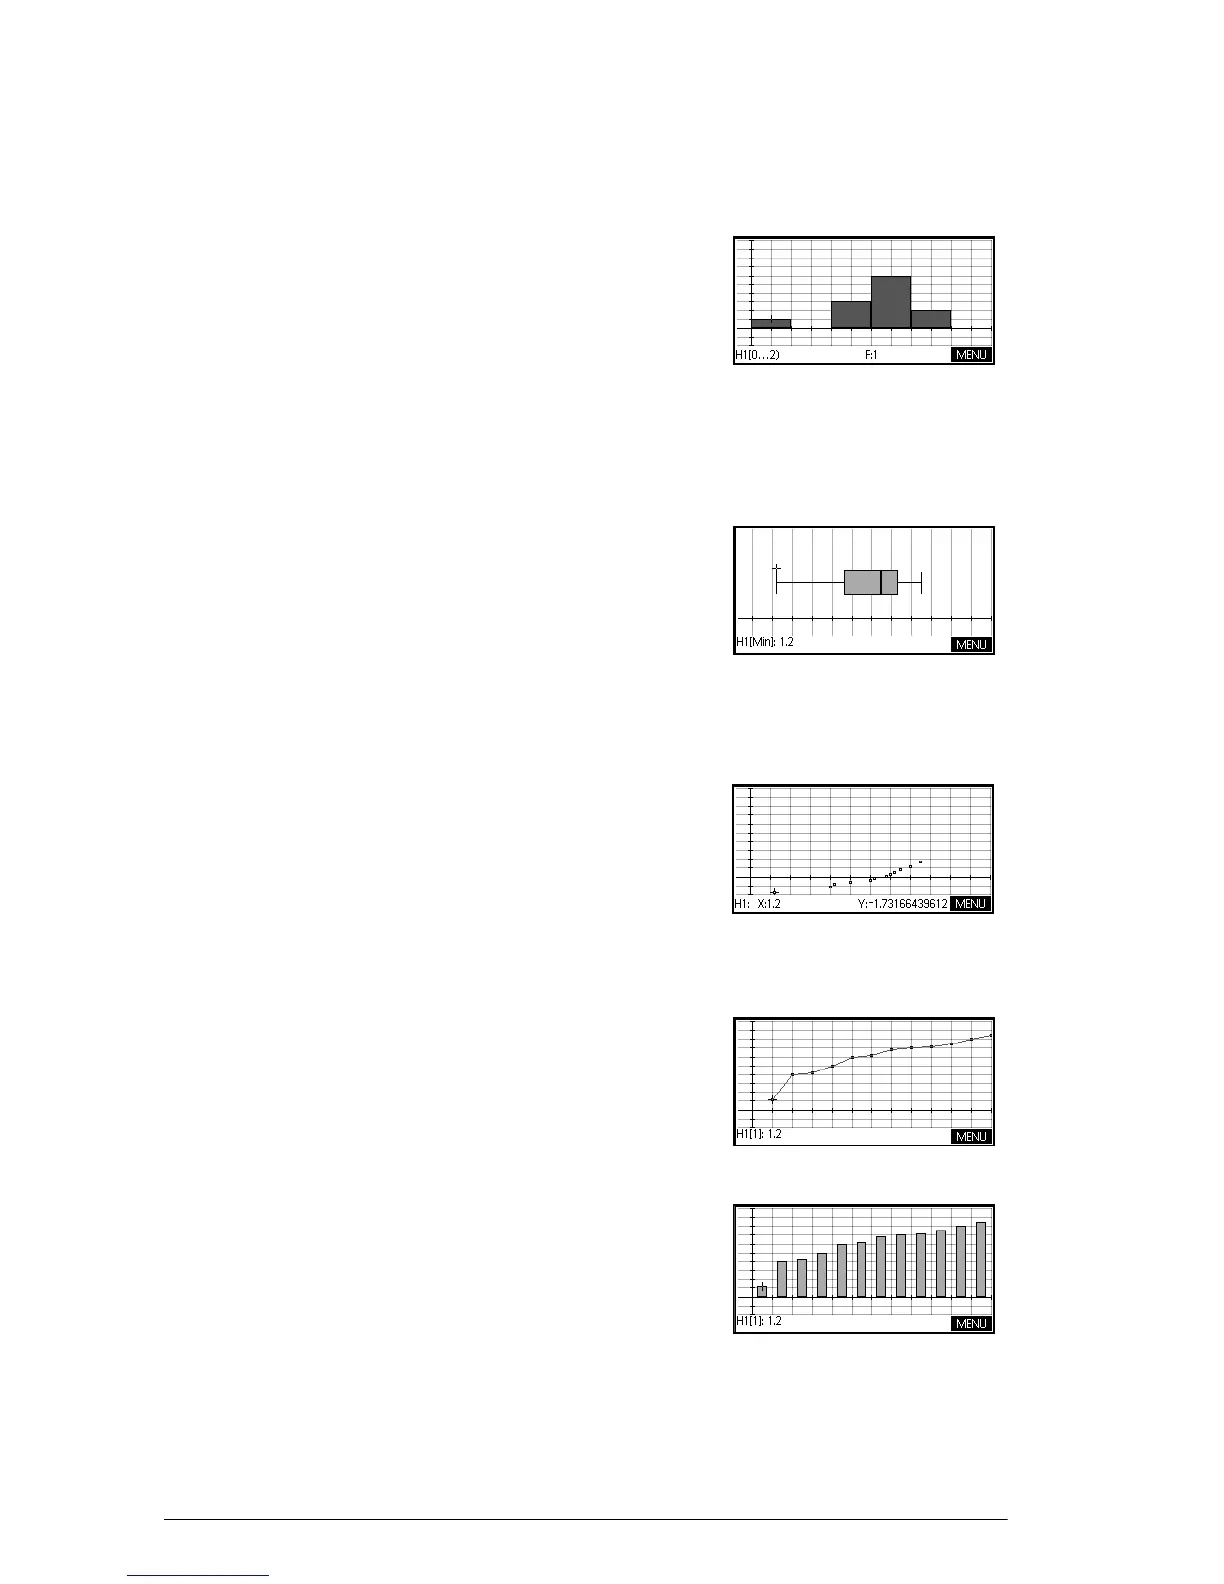
Histogram The numbers below the plot
mean that the current bar
(where the cursor is) starts at
0 and ends at 2 (not
including 2), and the
frequency for this column,
(that is, the number of data elements that fall between 0
and 2) is 1. You can see information about the next bar
by pressing
>.
Box-and-Whisker
plot
The left whisker marks the
minimum data value. The
box marks the first quartile,
the median (where the cursor
is), and the third quartile.
The right whisker marks the
maximum data value. The numbers below the plot mean
that this column has a minimum of 1.2.
normal
probability plot
The normal probability plot
is used to determine whether
or not sample data is more
or less normally distributed.
The more linear the data
appear, the more likely that
the data is normally distributed.
Line plot The line plot connects points
of the form (x, y), where x is
the row number of the data
point and y is the value of the
data point.
Bar graph The bar graph shows the
value of a data point as a
vertical bar placed along the
x-axis at the row number of
the data point.
 Loading...