Statistics 1Var app 81
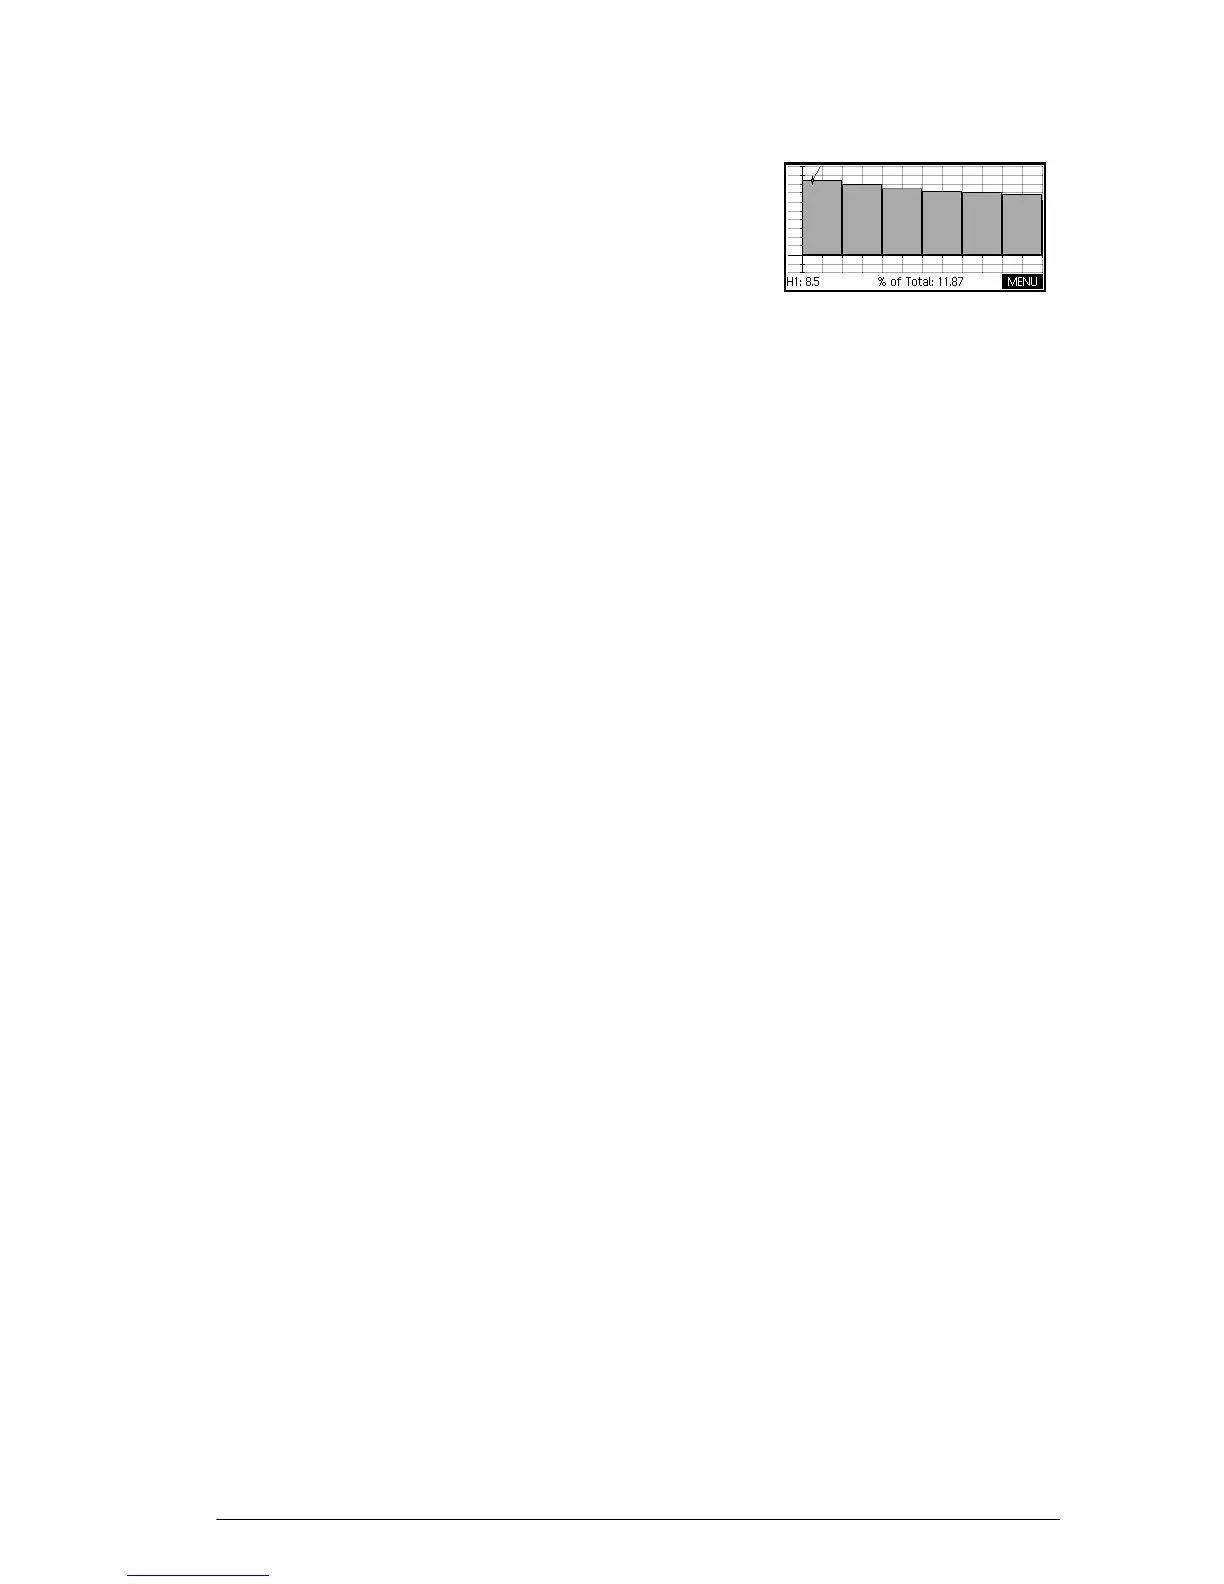
Pareto chart A pareto chart places the
data in descending order
and displays each with its
percentage of the whole.
Setting up the plot (Plot Setup view)
The Plot Setup (SSETUP-PLOT) sets most of the same
plotting parameters as it does for the other built-in HP
Apps. Settings unique to the Statistics 1Var app are as
follows:
Histogram width HWIDTH enables you to specify the width of a histogram
bar. This determines how many bars will fit in the display,
as well as how the data is distributed (how many values
each bar represents).
Histogram range HRNG enables you to specify the range of values for a set
of histogram bars. The range runs from the left edge of the
leftmost bar to the right edge of the rightmost bar. You
can limit the range to exclude any values you suspect are
outliers.
 Loading...