Finance app 133
Cash flow diagrams
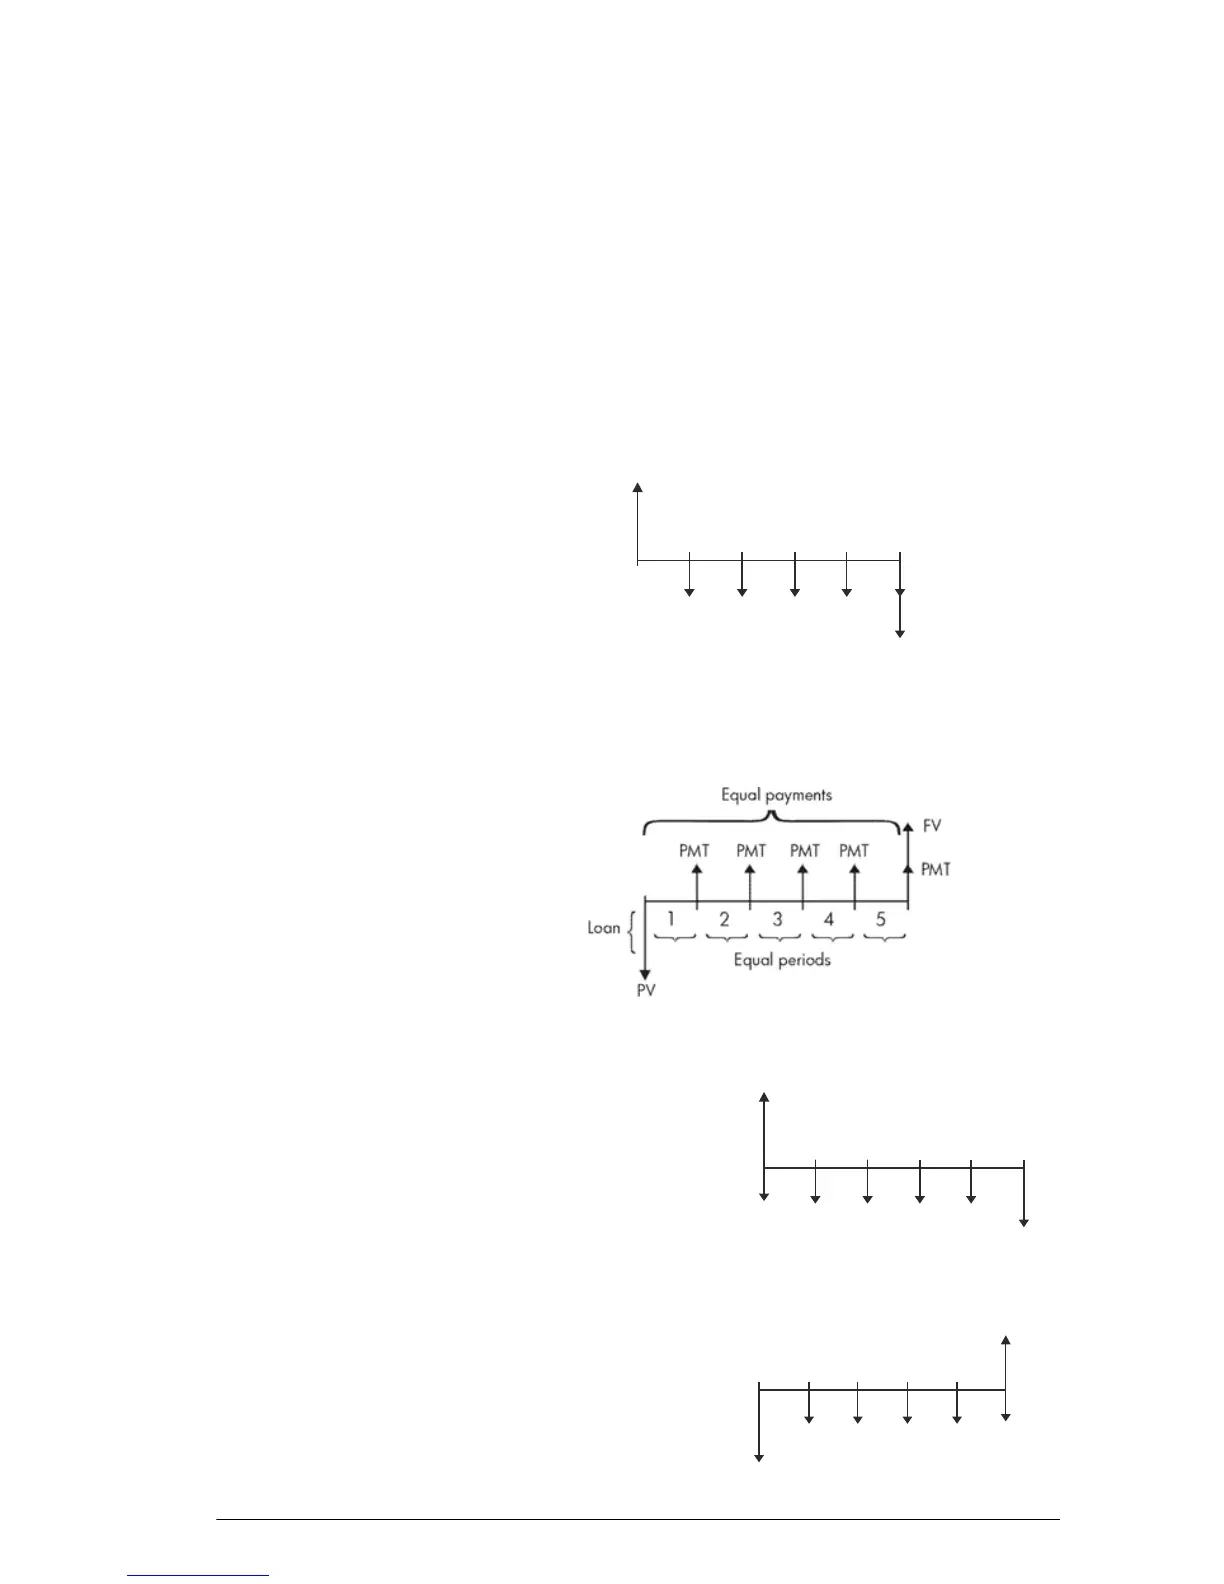
TVM transactions can be represented by using cash flow
diagrams. A cash flow diagram is a time line divided into
equal segments representing the compounding periods.
Arrows represent the cash flows, which could be positive
(upward arrows) or negative (downward arrows),
depending on the point of view of the lender or borrower.
The following cash flow diagram shows a loan from a
borrower's point of view:
The following cash flow diagram shows a loan from the
lender's point of view:
Present value (PV)
(Loan)
Money
received is
a positive
number
Money
paid out is
a negative
number
Equal periods
1
23
4
5
(PMT)
Future value
(FV)
Equal payments
Payment
(PMT)
Payment
(PMT)
Payment
(PMT)
Payment
(PMT)
}
}
}
}
}
Cash flow diagrams
also specify when
payments occur rela-
tive to the compound-
ing periods.The
diagram to the right
shows lease pay-
ments at the begin-
ning of the period.
This diagram shows
deposits (PMT) into an
account at the end of
each period.
PV
1
23
4
5
FV
Capitalized
value of
lease
}
PMT PMT PMT PMTPMT
PV
1
23
4
5
FV
PMT PMT PMT PMT PMT
 Loading...