ECG/RESP Monitoring
11-41
11.6.4 Data Review
If 12-lead monitoring is performed within the latest reviewable 96hr, you can review
the 12-lead trend data in the TRAND GRAPH and TREND TABLE window.
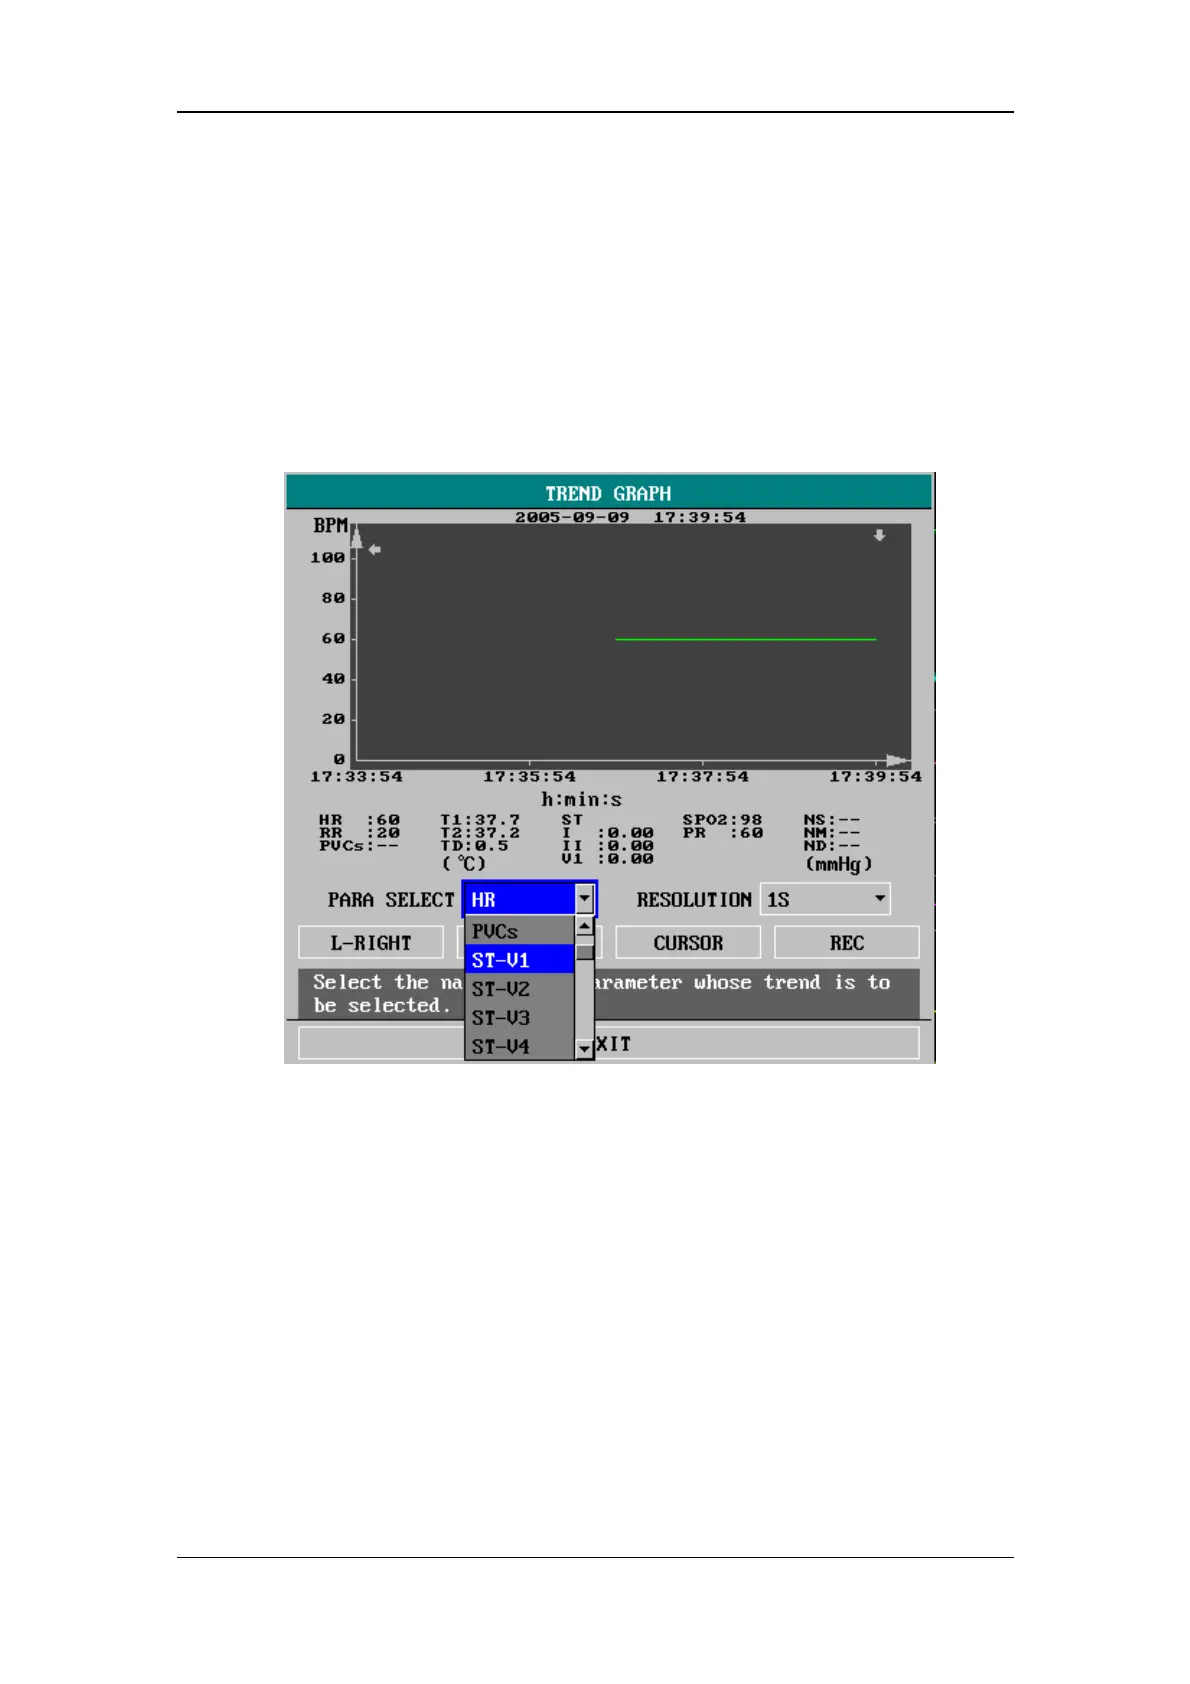
Trend graph
In SYSTEM MENU, select TREND GRAPH >>. The TREND GRAPH window
appears. For details about the trend graph, refer to 9.2 Trend Graph Recall.
Figure 11-29 Trend graph
In the 12-lead monitoring process, each ST numeric has a trend graph. In TREND
GRAPH window, when you select a ST parameter from PARA SELECT drop-down
list box; all ST numerics of its group will be displayed. If you select parameters
other than ST, only 3 ST numerics (I, II and V1) will be displayed.
Trend table
In SYSTEM MENU, select TREND TABLE >>. The TREND TABLE window
appears. For details about the trend table, refer to 9.3 Trend Table Recall.
 Loading...