Cursor function Measurements
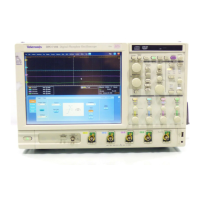
Horizontal cursors measure vertical parameters (amplitude) in volts,
watts, or IRE. The cursor readouts are defined as:
V1 = Level @ Cursor 1 with respect to its source ground level.
V2 = Level @ Cursor 2 with respect to its source ground level.
ΔV = Level @ Cursor 2 - Level @ Cursor 1.
Level is cursor displacement from the source ground multiplied by
the source in volts/div. The two cursors may have different sources
and therefore can have different volts/div settings.
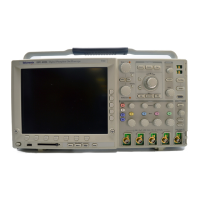
Vertical cursors measure horizontal parameters. Typically the
horizontal parameters are in time or frequency, but depend on the
units you select. The cursor readouts are defined as:
T1 = Time @ Cursor 1 with respect to the trigger point
T2 = Time @ Cursor 2 with respect to the trigger point
ΔT = Time @ Cursor 2-Time @ Cursor 1
Time is divisions of displacement of the cursor from its source
trigger point multiplied by the source in time/div.
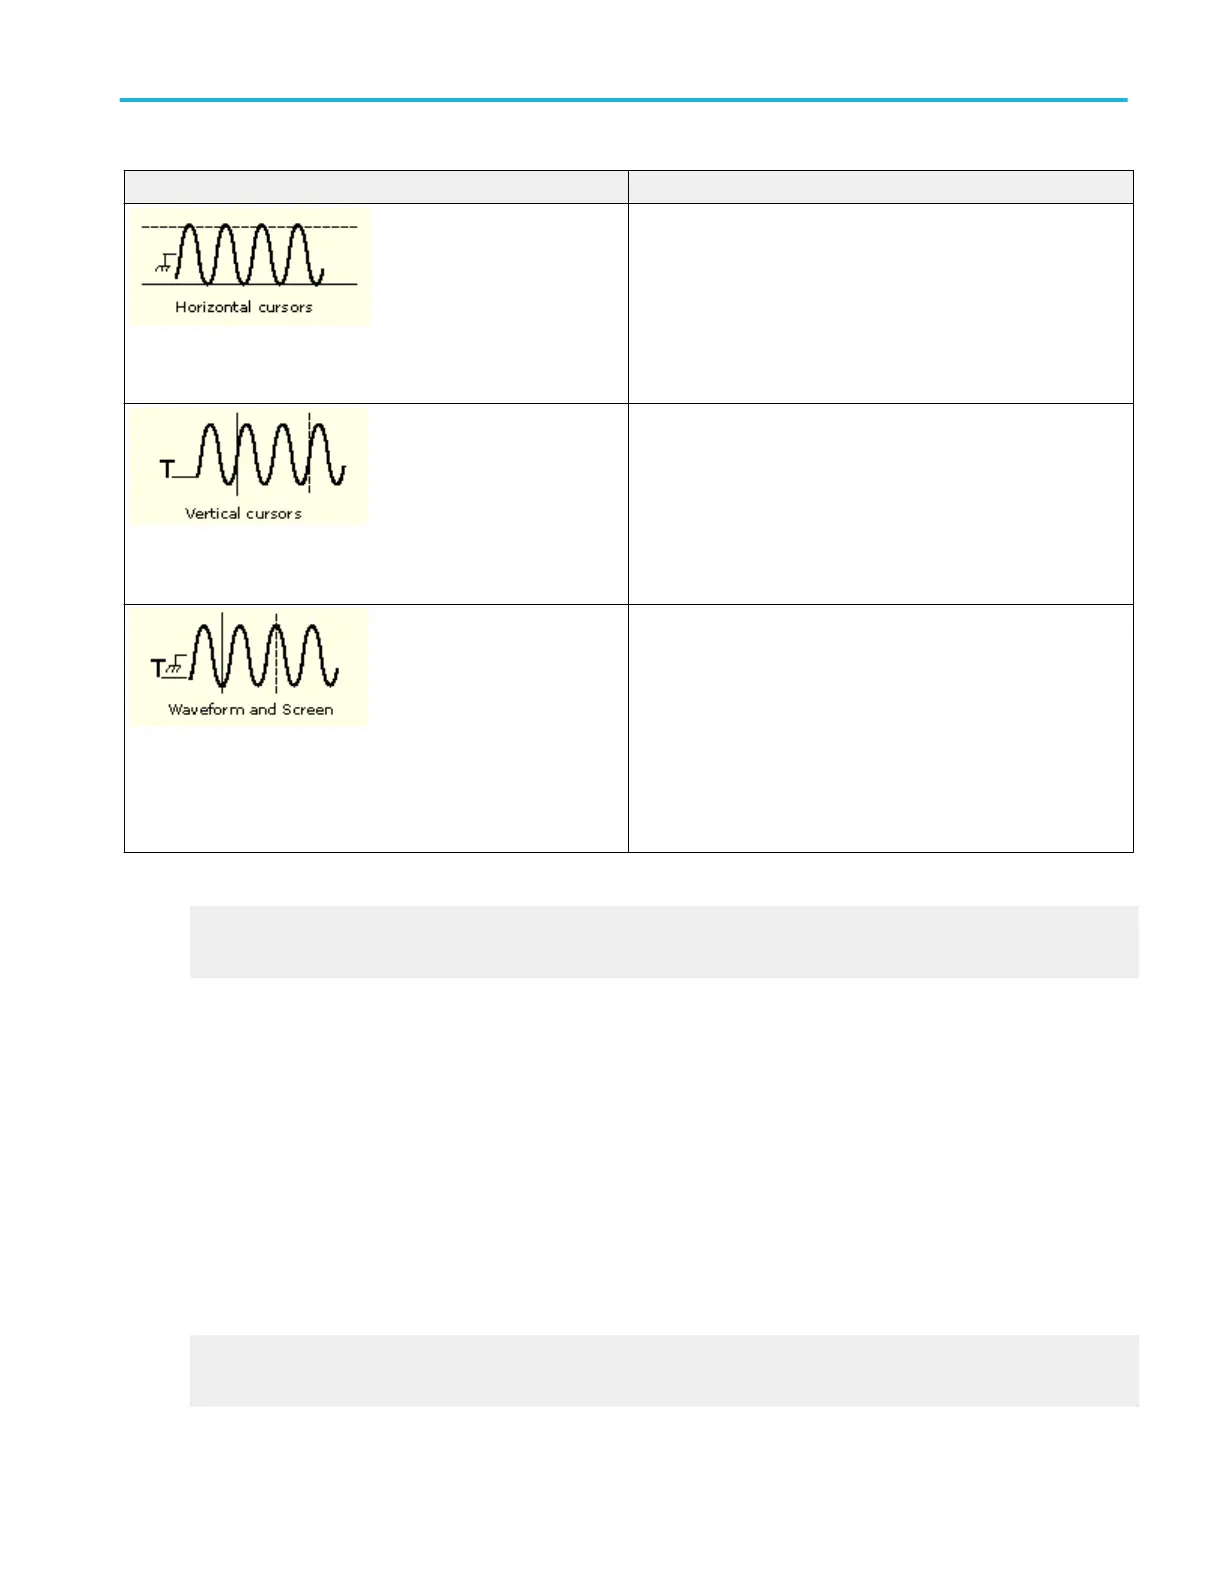
Waveform cursors measure vertical parameters (typically volts) and
horizontal parameters (typically time or frequency) simultaneously.
Each cursor is, in effect, both a vertical and horizontal cursor. These
paired cursors cannot be moved off of the waveform. The two
cursors can have a different source.
Use screen cursors to indicate an arbitrary X and Y position in the
waveform display area represented by the intersection of a vertical
and horizontal cursor line. Screen cursors measure both vertical
parameters (typically volts) and horizontal parameters (typically time
or frequency).
What do you want to do next?
Learn about histograms.
Go to a step-by-step procedure for taking automatic measurements.
Histograms
The instrument can display histograms constructed from the selected waveform data. You can display both vertical (voltage) and
horizontal (time) histograms, but only one at a time. Use histogram measurements to get statistical measurement data for a
section of a waveform along one axis.
The histogram source can be any channel, math, or reference waveform.
Turning on histograms starts histogram counting and data accumulation. A sample histogram display is shown below. Histogram
data is continuously accumulated until you explicitly turn off histograms. This allows you to continue collecting histogram data
even when you turn off the histogram display.
In addition to using limit controls to set histogram box boundaries, you can also use standard Windows drag-and-drop to resize
and reposition the histogram box.
Histograms are not available in Zoom modes.
Go to a step-by-step procedure for starting histogram counting.
Go to a step-by-step procedure for taking automatic measurements.
Oscilloscope reference
DPO70000SX, MSO/DPO70000DX, MSO/DPO70000C, DPO7000C, and MSO/DPO5000B Series 701
 Loading...