Monitor and control equipment
76 i-Vu CCN Pro 4.2
The
is a unique alphanumeric string that defines the
BACnet object. Although the
field can be edited, it is
not recommended. The
is set to 1 to receive
alarms generated by Carrier controllers.
NOTES
• Run a Trend Usage (page 83) report to view trend data.
• You can use Global Copy (page 32) to copy trend properties to other pieces of equipment that use the
same control program.
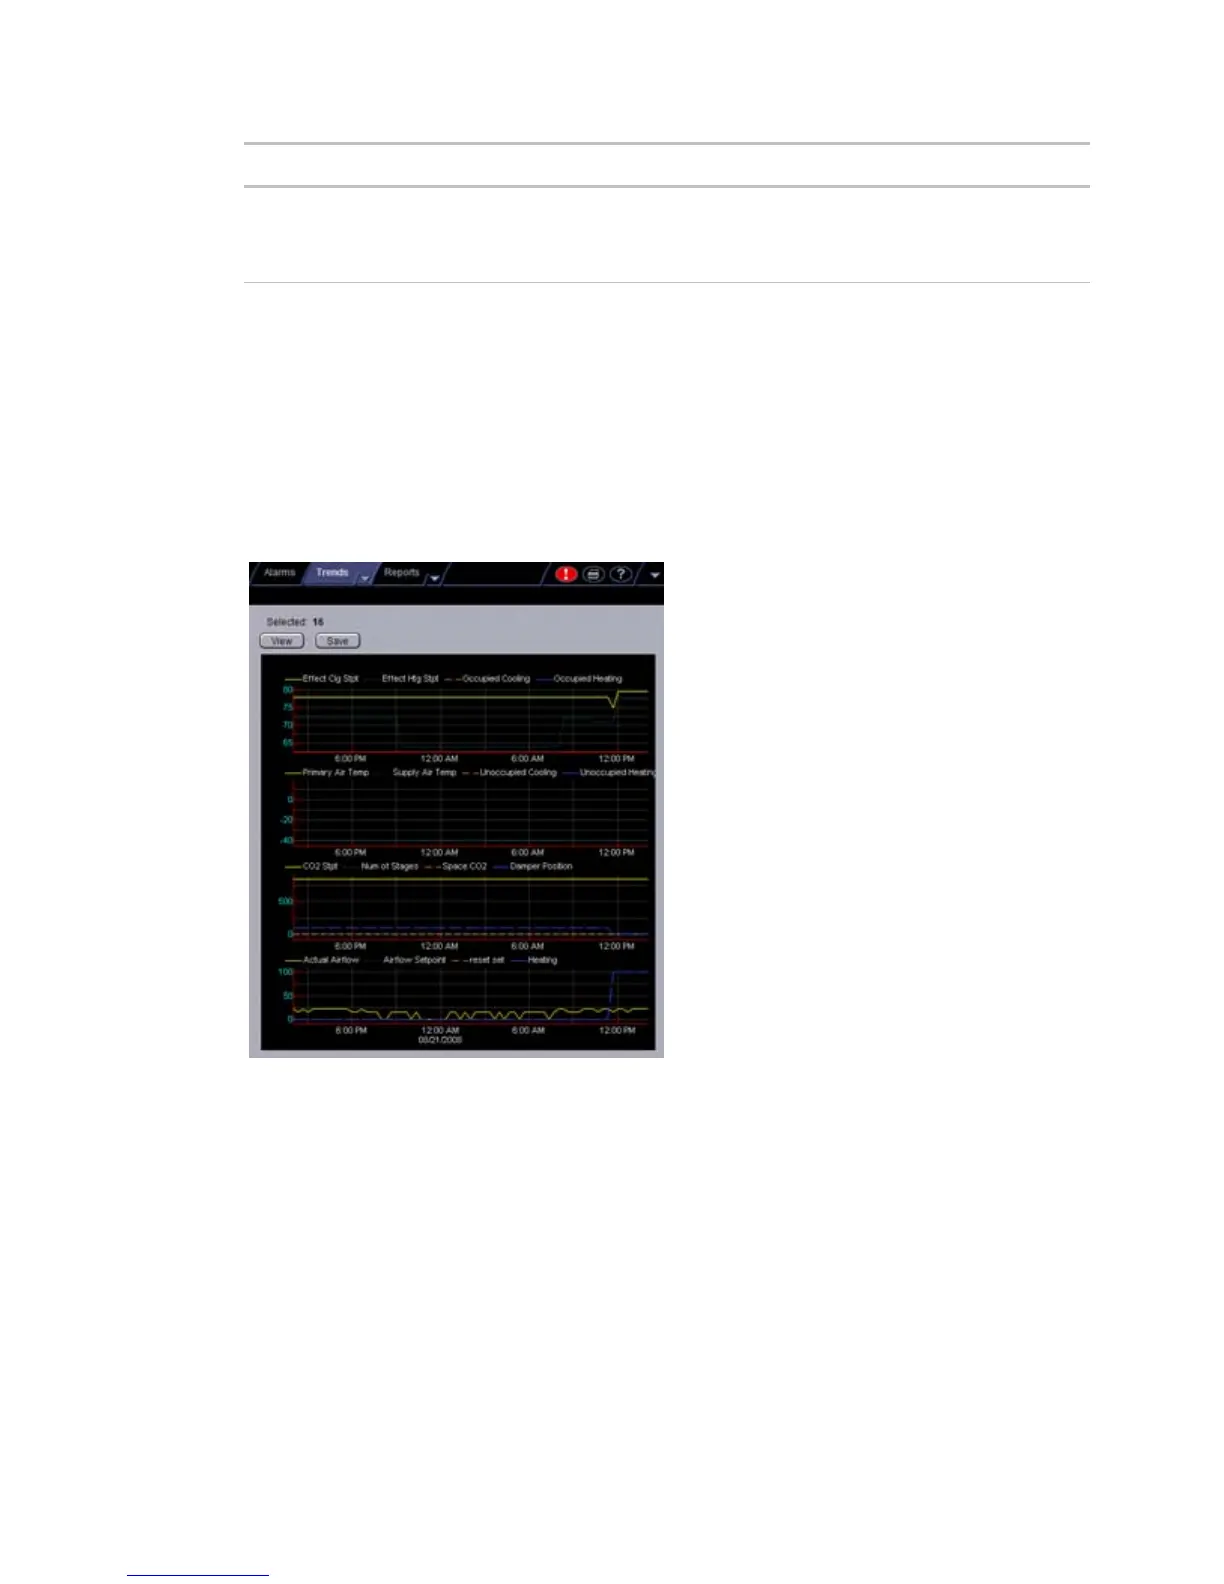
Graphing data for multiple points
You can graph multiple trend points simultaneously to help monitor and troubleshoot your system.
A comparison trend graph can display up to four graphs on the page. Each graph can display up to 4 similar
points - 4 binary points or 4 analog points.
NOTE Before you create a comparison trend graph, verify trending for the individual points you want to
include in the graph. See To collect trend data for a point.
To create a comparison trend graph
You can select up to 16 trends to view, then save them for graphing again later.
1 In the navigation tree, select the area or equipment where you want to view the graph.
2 Click the Trends button drop-down arrow, then select New Graph.
3 Select up to 16 trends from the selection tree. Use Ctrl+click, Shift+click, or both to select multiple
items.
 Loading...