FLEX-6000 Signature Series - SmartSDR for Windows Software User’s Guide
Page 27
Copyright 2018 FlexRadio Systems. All Rights Reserved.
audio, each Slice Receiver shares the same base performance as the other Slice Receivers. For the
operator, this means that access to two or more receivers with the same top performance may be
used interchangeably without concern for differing performance characteristics of each receiver
often found in superheterodyne receivers.
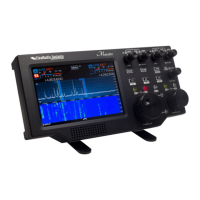
9.2.3 Panadapter
The Panadapter uses the data available from the SCU and turns it into a visual representation of the
radio frequency spectrum. The Panadapter display, pictured below, shows the level of signals
present across a specific region of the spectrum just as a spectrum analyzer would. The higher the
white line appears in the display, the stronger the signal is in that part of the band. A scale for the
absolute signal level in dBm (decibels relative to one milliwatt) is provided on the right-hand side of
the display. This allows the operator to quickly identify signals of interest where the operator can
focus his/her efforts.
Each Panadapter is derived from the data from a single SCU so it is possible in multiple-SCU radios to
show two different Panadapters tuned to the same region of the spectrum, each with data from a
different SCU and ultimately a different antenna. The Panadapter shows the current state of the
spectrum and can be adjusted to show various widths of spectrum. A Panadapter can be seen below:
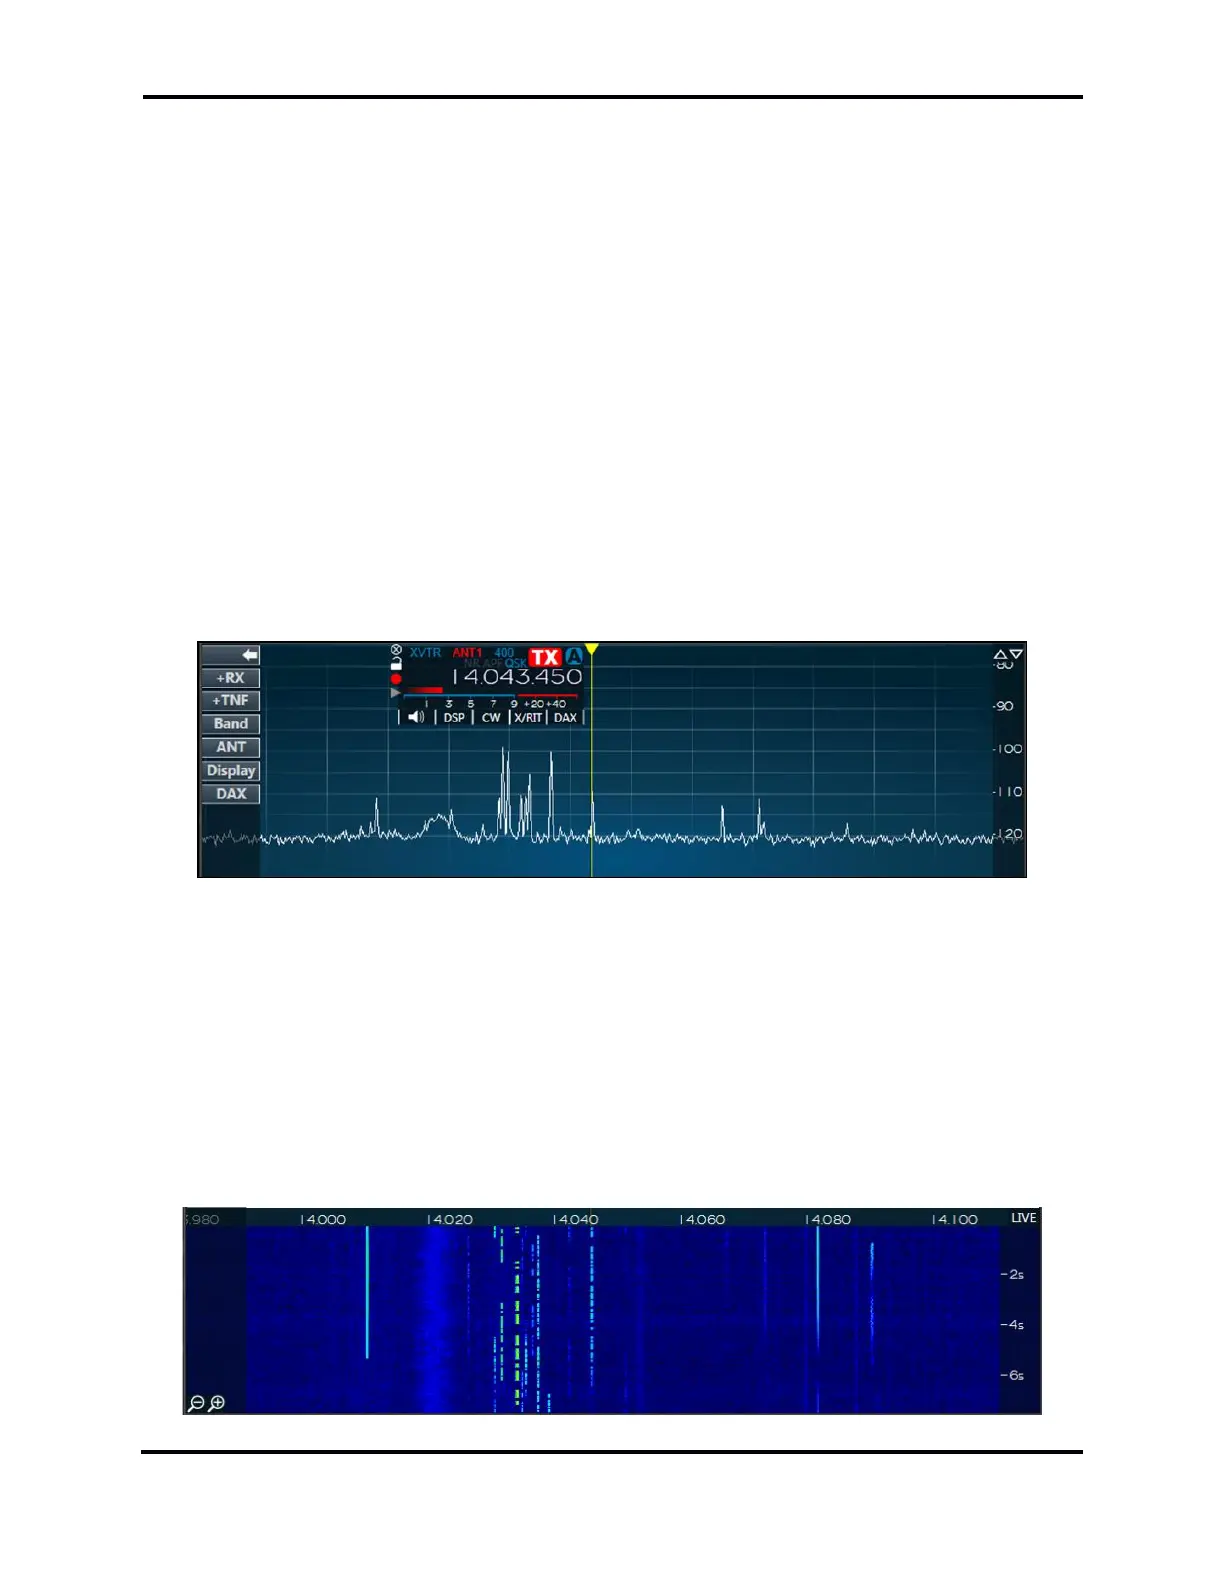
9.2.4 Waterfall
The Waterfall uses the same data from the SCU as the Panadapter and turns it into a time-based
visual representation of the spectrum. In the Waterfall, intensity of signal is represented by a change
in color in a similar way as water density is shown in weather radar. The vertical position in the
Waterfall represents the time that the information on the spectrum was obtained. The Waterfall
owes its name to the way that it continually moves downward like a Waterfall as time passes. The
Waterfall can be useful for understanding how signals are distributed in the spectrum over time,
locating where stations have recently transmitted and even locating “holes” where operation will not
interfere with other stations. A Waterfall can be seen below:
 Loading...